A new study by researchers at Imperial College London, published in Ecological Informatics, shows that hyperspectral sensing—a technology capable of detecting subtle differences in vegetation—can be employed to predict grassland biomass and biodiversity.
The findings underline the benefits for more effective monitoring of ecosystems at a time when climate change and land-use pressures are reshaping landscapes across the world.
What is hyperspectral sensing?
Grasslands play a crucial role in carbon storage, agriculture, and biodiversity, yet monitoring them at scale has long been a challenge.
Traditional field surveys are time-consuming, while many space-borne sensors lack the fine spatial resolution needed to marry with the sampling unit (e.g. field-plot).
Hyperspectral senors can capture reflected radiation across hundreds of narrow wavelengths, making it possible to detect signals pointing to variations in plant health, species diversity, and biomass. Leaves typically reflect weakly in the blue and red wavelengths because of absorption by photosynthetic pigments and strongly in the near-infrared wavelengths owing to refraction by intracellular structures. As a consequence, the spectral absorption response of vegetation in the red channel is strongly correlated with chlorophyll content whilst reflectance in the NIR is positively related to vegetation density. The contrast of these two domains has informed the development of vegetation indices (VIs) using reflectances corresponding to wavelengths with maximum and minimum sensitivity to properties such as variation in pigment concentration.
Inside the experiment
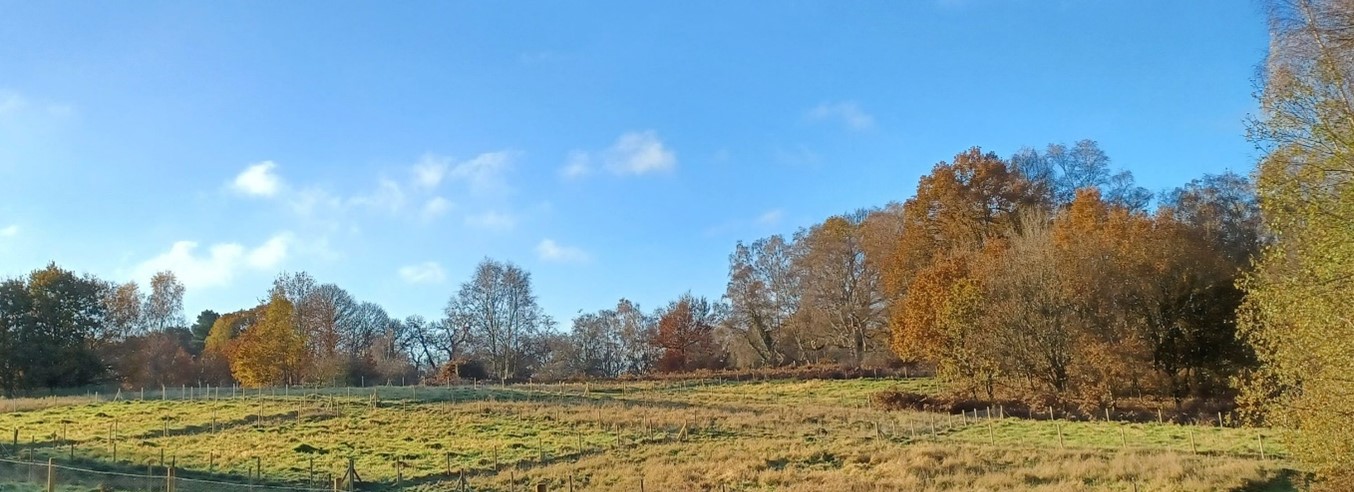
The study took place at Nash’s Field, a 30-year grassland experiment at Silwood Park, Imperial College’s research site near Ascot, UK.
The experimental site manipulates multiple treatments in a split-plot design . The treatments include herbivory, grazing, soil pH, plant competition and soil fertility. The full design encompasses 1,152 plots of 2 x 2 m, but constraints meant that this study could only undertake to sample a subset.
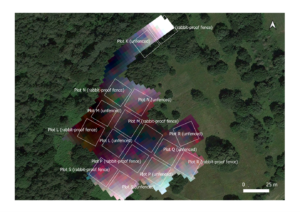
The team collected hyperspectral reflectance data from the grassland canopy between 25 May and 6 June 2018, using a handheld spectroradiometer. This period was chosen to coincide with peak vegetation growth under predominantly clear skies.
To complement the spectral analysis, aboveground biomass samples were collected from each plot during one week in August 2018. Before harvesting, scientists recorded the number of plant species within each plot, identifying dominant taxa to assess biodiversity. This allowed the team to assess how different environmental factors influenced vegetation growth and diversity.
Key findings
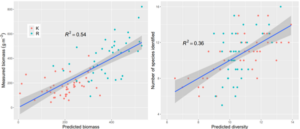
For response variables of plant biomass and species diversity, the study investigated whether an hyperspectral Partial Least Squares Regression (PLSR) model offered better predictions than a suite of popular two-band VIs. The PLSR technique has been designed to analyse data with numerous, collinear input variables and uses all available spectral wavelengths simultaneously. By contrast, two-band indices utilise only a fraction of the reflectance information available in hyperspectral data.
Among the results:
- The ‘red-edge’ advantage – A specific spectral region (700-750 nm) proved keyfor assessing plant biomass. There is growing evidence that this region is instructive about vegetation biochemical properties.
- Stronger predictions – The PLSR model outperformed traditional VIs, suggesting that hyperspectral imaging offers a more accurate and comprehensive way to monitor ecosystem health.
- Management matters – Different land management strategies altered the canopy reflectance patterns.
A new era for environmental monitoring?
While hyperspectral imaging offers major advantages, many current satellite sensors lack the spatial resolution needed for fine-scale ecological monitoring.
The European Space Agency’s FLEX mission, set to launch in 2025, will capture hyperspectral data at an ultra-fine 0.1 nm resolution, but with a 300m spatial scale—too coarse for monitoring the nutrient plots at Nash’s Field.
The challenge is to combine remotely sensed hyperspectral data (such as that from WorldView-3 that also offer fine spatial resolution) with ground-truth measurements, allowing for real-time ecosystem monitoring at spatial scales relevant to conservation and land management.
Why it matters
With global biodiversity under threat, researchers say these techniques could transform how we track environmental changes.
By harnessing hyperspectral sensing, scientists and policymakers could improve:
✅ Ecosystem monitoring – Tracking biodiversity and productivity shifts over time.
✅ Climate change research – Understanding how grasslands respond to warming and altered rainfall patterns.
✅ Conservation efforts – Informing land management decisions to protect natural habitats.
Dr. Keith Bloomfield, one of the study’s authors, said:
“Here at Imperial College, we are blessed to have Nash’s Field right on our doorstep. But sampling over 1000 plots requires a huge effort in the field. Our study offers the prospect of applying remote sensing techniques to routinely monitor the vegetation responses. It’s rocket science.”
What next?
The researchers hope to expand their approach at Nash’s Field to exploit the full complexity of the split-plot experiment. Moving from hand-held to space-borne sensors will allow for an efficient capture of the canopy reflectance signals across the entire experiment.
📖 Read the full paper here:
Ningthoujam, R.K., Bloomfield, K.J., Crawley, M.J., Estrada, C. & Prentice, I.C. (2025). Hyperspectral sensing of aboveground biomass and species diversity in a long-running grassland experiment. Ecological Informatics. https://doi.org/10.1016/j.ecoinf.2025.103028
This research was carried out by a team at Imperial College London, including members of the LEMONTREE project.