Wind speed and direction
Wind speed – three Vector Instruments A100LM anemometers, mounted at 2 m, 5m and 10 m above ground, provide wind speed readings using a low power pulsed output transducer. All three are polled once per second by the Campbell Scientific CR9000X logger. Standard ‘meteorological’ output consists of (i) ‘gust’ speeds – where the gust is defined as the highest running 3 s mean speed, and (ii) ‘mean’ speeds – which are normally 10 minute averages. The mean and gust derivations are in accordance with World Meteorological Organization and International Civil Aviation Organization specifications.
Wind speed is also logged at 10 Hz using a Gill Windmaster Pro sonic anemometer, measuring the three wind components (U, V, W) and the air temperature. From 12 April 2016, additional wind measurements made using three propeller anemometers sited adjacent to the Gill windsonic / Licor mast at 3 m height. Instruments arranged orthogonally, one mounted due S, one mounted due W and one mounted vertically All instruments are Gill fast response bi-directional propeller anemometers producing a voltage output proportional to wind speed. Data – 5 min average and 1 sec sample data can be found in the usual Level 1 METFiDAS data files under column headers U, V and W.
‘Climatological’ values of wind speed – mean speeds and maximum gust – normally refer to the ‘civil day’ (midnight to midnight UTC), and are currently derived from the logged values of these anemometers (prior to 1996 the ‘run of wind’ was from a cup-counter anemometer). The standard height for wind measurements is 10 m above ground.
Wind direction – a Vector Instruments W200P wind vane, mounted 10 m above ground level, provides continuous records of wind direction using a precision wire-wound potentiometer as a shaft angle transducer. The sensor is polled once per second by the Campbell Scientific CR9000X logger. Standard ‘meteorological’ output is normally vector-averaged over 10 minutes in accordance with World Meteorological Organization and International Civil Aviation Organization specifications, but 1 s data are logged.

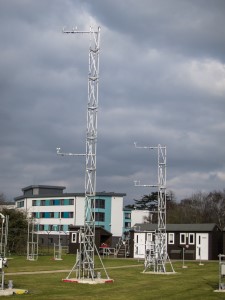
(Right) The two anemometer masts located within the Atmospheric Observatory, photographed March 2016. The nearer mast has anemometers at 2 m, 5 m and 10 m and a wind vane at 10 m; the far mast has anemometers at various heights from under 1 m to 7 m above ground. Photograph Copyright © Stephen Burt.

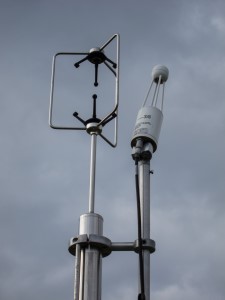
(Above) The Gill sonic anemometer (left of image) mounted alongside the Licor trace gas analyser (right), both located within the Atmospheric Observatory, and photographed March 2016. Photograph Copyright © Stephen Burt.
CALIBRATIONS
Manufacturer calibrations are used, generally dating from purchase date.
PERIOD OF RECORD AVAILABLE
Records of wind speed and direction observed at the 0900 UTC observation are available from January 1908 to date: prior to the move to the Whiteknights site in January 1968, wind speeds were estimated using the Beaufort scale. Daily ‘run of wind’ records at 7.6 m above ground (25 ft) are available from January 1960 to December 1984, at 11.6 m above ground (38 ft) from January 1974 to October 1989, at 10 m above ground from January 1989 to December 1992, and additionally at 2 m above ground from January 1968 to date. (The ‘run of wind’ records the total distance ‘travelled’ by the wind at the anemometer site in 24 hours, usually 0900-0900 UTC: to obtain a daily mean wind speed in m/s, divide the run of wind in km by 86.4.)
Daily mean wind speed and ‘maximum gust’ values are available from January 1968. There are gaps in the record, particularly between July 2014 and spring 2015 when no values of wind speed or direction at 10 m were available owing to replacement of the anemometer mast: records from the anemometer and wind vane at 5 m were temporarily substituted (winds at 10 m are, on average, about 10% stronger than at 5 m). Automatic (logged sub-daily) wind speed and direction records at 10 m are available from 1996 to date, although with gaps in the record.
How to request climatological data from the Observatory
Sensor manufacturer links:
Vector Instruments A100LM anemometer
Vector Instruments W200P wind vane
Gill Windmaster Pro sonic anemometer
Operational notes or changes:
|
Date
|
Change
|
|---|---|
|
31 Mar 2016
|
Existing 2 m and 10 m anemometers examined following spurious high readings on 28 March; sensors and connections checked for water ingress (none found). Both sensors replaced, with a short period of missing data as a result
|
| 12 April 2016 | Additional wind measurements: three propeller anemometers sited adjacent to the Gill windsonic / Licor mast at 3 m height. Instruments arranged orthogonally, one mounted due S, one mounted due W and one mounted vertically All instruments are Gill fast response bi-directional propeller anemometers producing a voltage output proportional to wind speed. Data – 5 min average and 1 sec sample data can be found in the usual Level 1 METFiDAS data files under column headers U, V and W. Data are valid from 09:30 GMT 12/04/2016. |
| 1 Dec 2016 | ‘Catastrophic failure’ of the 10 m mast; wind sensors at 2 m, 5m and 10 m removed pending re-erection of the mast, now expected early Feb 2017 |
|
8 Feb 2017
|
U5, U10 and Dirn10 restored from 13:00 |
This page updated January 2018