Atmospheric electricity
Atmospheric electricity
The main atmospheric electricity (potential gradient, PG) instrument on our site is a JCI 131 Electrostatic field meter or Field Mill manufactured by John Chubb Instrumentation. This device is based on a ‘field mill’ principle utilising a rotating chopper. The DC output signal from this instrument is proportional to the PG measured at the sensing aperture. Within the Observatory, the unit is currently mounted at 3 m above ground level. The measurements are standardised to the PG at 1 m, as obtained using a long wire antenna.
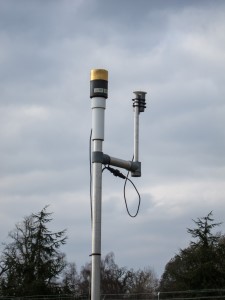
The Chubb JCI 131 electrostatic field meter (on the left), mounted at 3 m above ground within the Atmospheric Observatory, photographed March 2016. Photograph Copyright © Stephen Burt.
The vertical conduction current is also measured, using two horizontal electrodes mounted to be flush with the Observatory surface. The current flowing into each electrode is determined using an electrometer. Two different collecting electrodes are used, a ‘flat plate’ and a ‘corrugated plate’ (see bottom photograph). The electrodes have the same surface area but different topologies: the differences in the measured currents allow the conduction current to be separated from displacement current induced by changes in the PG.
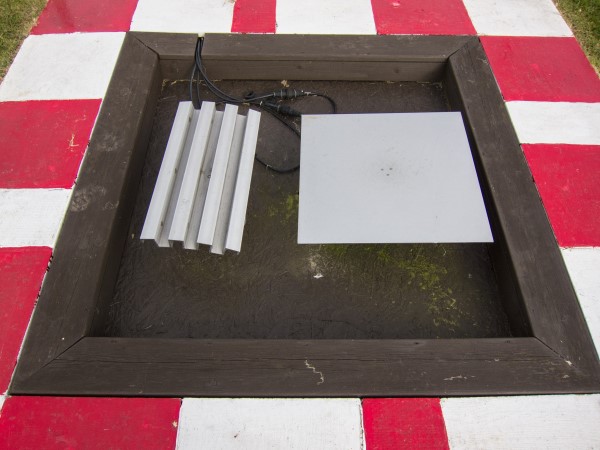
Corrugated and flat plate vertical atmospheric electricity current sensors.
Point Discharge Current
A long-established method of measurement in atmospheric electricity is determining the current flowing through an upwards-facing elevated sharp point connected to earth. This is known as the Point Discharge Current (PDC). The sharpness of the elevated point acts to concentrate the electric field lines, which, if the electric field is sufficiently large under thunderstorms or other electrified clouds, can cause the air to breakdown. In some circumstances this can become visible as St Elmo’s fire. Under breakdown conditions the PDC is typically a few microamps (10-6 A), and positive or negative depending on the polarity of the electric field, but it is otherwise many orders of magnitude smaller, ranging from picoamps to nanoamps (10-12A to 10-9A). An enhanced PDC is essentially an indicator of strongly distributed electrical conditions, although it is also affected by wind speed.
Because of its wide range of values, the PDC is challenging to measure. At Reading, an electrometer with a logarithmic response has been developed specially to do this (Marlton et al, 2013), connected to an elevated point at 3m above the ground. The electrometer works by exploiting the logarithmic response intrinsic to semiconductors – in this case using light-emitting diodes in a light-tight enclosure – to allow measurements of current from 10-14A to 10-5A. Such a large dynamic range of nine orders of magnitude is probably unique for a meteorological measurement instrument.
In one of the most significant papers of atmospheric electricity, confirming CTR Wilson’s “global circuit” conceptual picture, PDC measurements at Kew Observatory between 1932 and 1934 were analysed. The PDC at Kew was found to follow the global thunderstorm occurrence (Whipple and Scrase, 1936). Increased PDC is not just found under thunderstorms, but in some other electrically disturbed situations, for example beneath dust devils (Lorenz et al, 2016).
PERIOD OF RECORD AVAILABLE
Field mill records commenced November 2004.
How to request climatological data from the Observatory
Sensor manufacturer link:
Chubb JCI 131 Electrostatic fieldmeter
Operational notes or changes:
|
Date
|
Change
|
|
|---|---|---|
|
26 Nov 2004
|
Field Mill Installed at 2 m, north side of site. Recorded on channel B3. Source: Research channel info file
|
|
|
April 2005
|
Wiring errors detected. Grounding and auto-ranging wrongly configured. New junction box made. Source: RGH notebook and research channel info file | |
|
1 May 2005
|
PG = 387.0×V +12. Source: AJB thesis |
|
|
17 Jan 2007
|
|
References
Ralph D. Lorenz, Lynn D.V. Neakrase, John P. Anderson, R. Giles Harrison, Keri A. Nicoll, Point discharge current measurements beneath dust devils (2016), J Atmos Sol Terr Phys 150–151,55–60 http://dx.doi.org/10.1016/j.jastp.2016.10.017
G.J. Marlton, R.G. Harrison, and K.A. Nicoll, Atmospheric point discharge current measurements using a temperature-compensated logarithmic current amplifier Rev Sci Instrum 84, 066103 (2013) doi: 10.1063/1.4810849
F.J.W. Whipple and F.J. Scrase (1936), Point discharge in the electric field of the Earth. Meteorological Office Geophysical Memoirs 68, HMSO, London
This page updated March 2020