Methods and participants
Our sample consisted of 76 families/carers or foster carers and 63 practitioners working in education or social care for children listed as “vulnerable” during the COVID-19 outbreak. The sample was sourced from the South and South West of England between April-July 2020. The e-surveys included 25 and 21 questions respectively exploring the views of respondents on aspects relevant to distance learning, wellbeing, mental health during the outbreak and safeguarding as well as reopening of schools after the outbreak.
Figure 1 shows the gender of participants by group. It is noticeable that most respondents were female.
Figure 1
Gender by Group of Participants


Tables 1 and 2 present the roles in the sample by group. Percentages per row represent the proportion of participants selecting each option in the total of participants in their group (Practitioners N=63, Families N=76). For cohesiveness, in this report, we will refer to the two groups as ‘practitioners’ and ‘families’.
Table 1
Roles of Practitioners
| Roles | Raw Number | % |
| Head or Deputy of school/setting/institution | 12 | 19 |
| Manager of a team | 10 | 15.9 |
| SENCo/aspiring SENCo/Inclusion Lead or Deputy | 23 | 36.5 |
| Teacher | 21 | 33.3 |
| Teaching Assistant | 6 | 9.5 |
| Other staff in education (LAs included) | 8 | 12.7 |
| Social worker | 1 | 1.6 |
| Other staff in social care or children’s services (LAs included) | 3 | 4.8 |
| NA | 1 | 1.6 |
| Total | 85 | NA |
Note. Participants could select multiple options resulting in percentages not adding up to 100%.
Table 2
Roles of Family Members
| Roles | Raw Number | % |
| a parent/carer | 73 | 96.1 |
| a foster carer | 3 | 3.9 |
| 76 | 100 |
Figure 2 shows the age range of children by stage of education for practitioners and age group for families. It is noticeable that most practitioners were working with children in primary or secondary education and most families had children between 4 and 16 years old.
Figure 2
Stage of Education for Practitioners and Children’s Age Range for Families
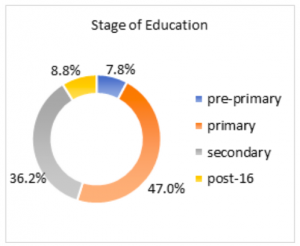

Note. Answers of practitioners are shown on the left and of families on the right.
Practitioners responded about different types of schooling as shown in Table 3 below. Respondents could select multiple choices. Raw numbers and percentages represent popularity of each type of schooling.
Table 3
Types of Schooling for Practitioners
| Types of Schooling | Raw Number | % |
| Mainstream school | 21 | 24.4 |
| Special school | 9 | 10.5 |
| Local Authority maintained school | 23 | 26.7 |
| Part of multi-academy trust | 17 | 19.7 |
| Independent school | 2 | 2.3 |
| Registered childcare provider | 2 | 2.3 |
| FE, colleges, post-16 institution | 2 | 2.3 |
| Home–schooling | 2 | 2.3 |
| LA and social care | 5 | 5.8 |
| Alternative provision | 3 | 3.4 |
| Total | 86 | 100 |
Participants responded about groups of children they worked with as presented in Table 4. Percentages per row represent the proportion of participants selecting each option in the total of participants in their group (Practitioners N=63, Families N=76). It is noticeable that higher percentages in both groups worked or cared for children with Special Educational Needs and Disabilities (SEND). In the group of participants, high percentages were also accrued for children with and in-need/protection plan, looked after children, assessed as otherwise vulnerable during the COVID-19 outbreak, and children of key-workers. About one third of practitioners also worked with children that had English as an Additional Language (EAL).
Table 4
Groups of Children per Sample Group
| Group | Practitioners | Families | ||
| Raw Number | % | Raw Number | % | |
| SEND | 51 | 81 | 68 | 89.5 |
| In–need/protection plan | 41 | 65.1 | 6 | 7.9 |
| Looked-after | 38 | 60.3 | 4 | 5.3 |
| EAL | 25 | 39.7 | 2 | 2.6 |
| Refugee/unaccompanied minor | 5 | 7.9 | 1 | 1.3 |
| Disadvantaged background | 34 | 54 | 6 | 7.9 |
| Assessed as otherwise “vulnerable” | 39 | 61.9 | 17 | 22.4 |
| Children of keyworkers | 38 | 60.3 | 5 | 6.6 |
| Other | 4 | 6.3 | 3 | 3.9 |
| Total | 275 | NA | 112 | NA |
Note. Participants could select multiple options resulting in percentages not adding up to 100%.
We explored further the types of SEND of learners in our sample. Many practitioners and families worked or cared for children with Autistic Spectrum Disorder (83.6% of practitioners working with SEND, 67.1% of families of children with SEND). Other types of SEND that accrued high percentages were Social, Emotional and/or Mental Health Difficulties (77% of practitioners and 49.3% of families), Specific Learning Difficulty (e.g., dyslexia, dyscalculia) (62.3% of practitioners and 27.4% of families) and Speech, Language and Communication Difficulties (59% of practitioners and 41.1% of families).