In our November science meeting, we covered an incredible amount of research on the theme of Ecohydrology. We heard from five members of the LEMONTREE team and below is a summary of all the talks:
- Colin Prentice: Ecohydrological concepts for next-generation land surface modelling.
- Xu Lian: Recent global decline in rainfall interception loss due to altered rainfall regimes.
- Pierre Gentine: Observation-driven estimates of transpiration to evapotranspiration ratios (E:ET).
- Rodolfo Nobrega: Optimal root zone capacity from a hydrological perspective (and with hydrological implications).
- Huiying Xu: Global variation in the ratio of sapwood to leaf area explained by the optimality principle.
Colin Prentice: Ecohydrological concepts for next-generation land surface modelling.
There are two major practical research questions in ecohydrology that we must tackle urgently within the LEMONTREE project. The first is how to predict leaf area index (LAI) from first principles; the second is how to reduce GPP (and transpiration) at low soil moisture. Furthermore, we would like to explore a more fundamental theoretical question as to whether hydrological partitioning is governed by vegetation optimality principles, and if so, how.
Leaf Area Index
LAI is the key control of both GPP and transpiration and therefore, links the carbon and water cycles. Despite its importance, LAI is not well represented or tested in DGVMs and LSMs. The allocation of NPP to roots, stems and leaves are commonly either assumed to be fixed according to to plant functional types (PFTs), or modelled using the old CASA scheme – which we have tested against a large global data set of root mass fractions. We found that it does not work well; perhaps not surprisingly, as when it was developed there were virtually no data available to test it.
As an alternative approach, scientists within the LEMONTREE group have recently been developing an optimality principle for LAI (LAIopt). The idea is that LAI may be limited by either:
- energy (leaf allocation maximizes net profit, i.e., GPP minus leaf construction and maintenance costs), or
- water (leaf allocation uses a certain fraction of annual precipitation).
LAIopt is thus modelled as the lesser of energy- and a water-limited rate. Using the P-model we can calculate both potential annual GPP and the attendant water use in a consistent way. Our modelled LAI results compare well to MODIS seasonal maximum LAI in terms of global patterns. However, at the regional scale, we would like to know more about the hydrological partitioning and timescales and the controls of the parameter (f0) that represents the fraction of precipitation available to plants. This parameter is the product of two ratios: Evaporation: Precipitation, and Transpiration: Evaporation.
Different approaches can be taken to analyse the controls of f0. One is based on latent heat flux (eddy covariance) measurements and specifically on the time course of evaporation during dry periods following rain events. This approach provides data for individual sites, and information on a time scale of days to weeks. Another uses rainfall-runoff data, providing information for catchments and annual timescales. Either approach can be used to estimate hydrological partitioning parameters from data. We can then seek patterns in these parameters related to climate, topography, and vegetation – in the first instance to develop (semi)empirical models for practical application, but also to test the long-standing hypothesis that observed regularities in hydrological partitioning (such as the Budyko curve) reflect optimal water use by vegetation.
Soil moisture stress in LSMs
Soil moisture stress is typically represented in LSMs with a water stress function, β, which down-regulates both transpiration and GPP as a function of volumetric soil moisture. The β function as usually described has two parameters: a threshold value of soil moisture at which stomata start to close, and a wilting point at which they close completely. There can also be a third parameter, a maximum ‘well-watered’ value. Most models recognize that the β function is not globally fixed but rather is set by the properties of the vegetation. I want to share three recent approaches regarding how plants may be optimizing their soil moisture stress functions.
1 Fu et al. in press (Science Advances) analysed eddy covariance measurements of evaporation (evaporative fraction is on the y-axis of the Figures below) in comparison to in situ measurements of soil moisture. in the Figure below, the blue lines refer to grasslands and the red to savannah. The savannah carries on transpiring down to a lower level of soil moisture than the grassland, but then more rapidly tails off (left panel). Interestingly, applying the ‘savannah function’ yields higher annual water use (and thus also GPP) than the ‘grassland function’ in savannahs, while the converse is true for grasslands (right panel). This is evidence that the vegetation is maximizing its water use or its GPP.

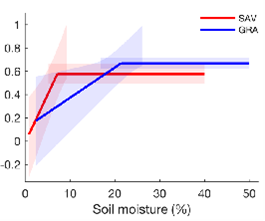
Figure 1. Eddy covariance measurements of evaporative fraction in comparison to in situ measurements of soil moisture. The blue lines refer to grasslands and the red to savannah.
2 Joshi et al. 2022 (Nature Plants) take a different approach, making plant hydraulics explicit and modelling soil moisture stress based on a cost function related to the risk of hydraulic failure. Their model, which is an extension of the P model, has several parameters that can be fitted to data from dry-down experiments. The Figure below illustrates the good fit that can be obtained. This relates to two species of Eucalyptus, one adapted to dry environments (E. populnea) and the other not. The next step in this research will be to investigate ways in which the model’s parameters may be optimized for different hydroclimates. You can read more about this study in the recent REALM blog.
3 The novel approach taken by Bassiouni et al. (in prep.) combines elements of the first two. An analytical solution of the equations linking water transport controls in the soil-plant-atmosphere continuum forms the basis for representing alternative β functions in terms of soil and plant hydraulic parameters. It is hypothesized that optimal plant behaviour maximizes transpiration, weighted by water stress. Soil moisture data are used to infer actual values of model parameters.
Xu Lian: Recent global decline in rainfall interception loss due to altered rainfall regimes
Canopy interception of rainfall (Ei) is the fraction of rainfall that is intercepted by leaves, branches, and stems. It is the first process of precipitation partitioning at the surface. The amount of Ei directly determines how much water is available for runoff or soil moisture. However, due to a lack of site observations, the accurate role of Ei in global surface water balance, particularly at large spatial scales, is underexplored. Therefore, our recent work has focussed on how to separate Ei from flux tower evapotranspiration measurements using machine learning and to understand the environmental factors driving its changes. This will enable us to make global-scale estimates of Ei.
The core concept is that Ei occurs exclusively under wet canopy conditions and is a primary component of ET during or shortly after rain events. Using flux tower measurements as inputs, we created two hybrid machine learning models that were trained with samples from wet spells, HMwet (capturing observed changes under wet conditions) and dry spells, HMdry (hypothesized value in the absence of rainfall).
Rainfall interception (Ei) = [LE by HMwet] – [LE by HMdry]
Using a machine learning model, we forced data for the rainy and rainless samples by the same set of variables, except that the wet models were also forced by a proxy for canopy water storage derived from 8 variables describing rainfall characteristics. Both HMwet and HMdry are fed with the same rainy data, so the difference in their LE estimates is contributed by canopy interception. The canopy interception, as expected, is highest over the evergreen needle forest of the evergreen broadleaf forest and lowest over the savannah.
We explored the event-level relationships between Ei/P (P=rainfall amount) and rainfall/vegetation characteristics. We found that rainfall characteristics of total P, Max P, and average P had a primary control on the Ei/P variations, where they were inversely related to Ei/P. This is understandable as after heavy rains, the canopy is saturated, and any more rain no longer contributes to canopy interception. However, there is a weak control of LAI on Ei/P, due to the confounding effects of rainfall intensity or the result of an inconsistent scale used for LAI and LE.
Next, we predicted a global map of Ei using ERA5 forcing data and MODIS satellite data, all aggregated into 0.5 degrees over 2000-2020 for both Ei and Ei/P for different products and climate zones. We found that Ei increases with precipitation, but there is a decrease in Ei/P with increasing precipitation.
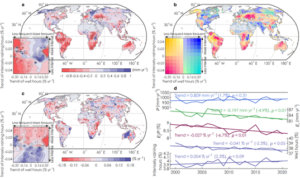
Figure 2: Trends of Ei (a), rainfall characteristics (b) and Ei/P ratio (c) for 2000−2020. Trajectories of global mean values are presented in d.
Looking at the temporal changes of Ei/P from 2000-2020 controlled by rainfall characteristics, in plot d) we see from the top blue line that there is no significant change in total rainfall over this period. However, there is a significant decrease in Ei/P (red line), which is due to a shift in rainfall patterns which are now less frequent but more intense. This altered rainfall regime has therefore resulted in lower canopy rainfall interception.
Lian, X., Zhao, W. & Gentine, P. Recent global decline in rainfall interception loss due to altered rainfall regimes. Nature Communications (in press).
Pierre Gentine: Observation-driven estimate of transpiration to evapotranspiration ratios (T:ET)
The Big Leaf approach calculates all the fluxes from the land surface as if they were coming from one single big leaf: an example is the Penman-Monteith equation for evaporation. However, this lacks information on the partitioning between transpiration and soil evaporation. In this study, we developed a simple and objective way to separate the conductance from the soil (evaporation) from the vegetation (transpiration) based on observational data using a two-source model of evaporation and transpiration to estimate T:ET.
To do this, our ‘trick’ was to assume that only the vegetation component, i.e., transpiration, is related to photosynthesis, not the evaporation from the soil (Gsoil). Therefore, canopy conductance (Gveg) was assumed to be proportional to GPP. We obtained Gs from the Penman-Monteith inversion of the latent heat flux based on FLUXNET 2015 data. G1 (water use efficiency) is assumed to be dependent on soil moisture, and this dependence is learned from the data, and G0 is made dependent on soil moisture and VPD.
Gs– G0 +G1 (GPP/VPD)
We explored how soil moisture affects the T:ET. As expected, there is more soil conductance Gsoil, i.e., more soil evaporation, as we increase soil moisture. For T:ET we can see strong seasonal cycle patterns. We also see a strong dependence of T:ET on LAI as an emergent behaviour, increasing as a function of LAI, as expected, reaching a saturation threshold at high LAI.
Our results from this study were in close agreement with the results from 6 other studies which include meta-analysis (Wang et al., 2014; Schlesinger & Jasechko, 2014), flux data (Zhou et al., 2016), isotope data (Good et al., 2015) and physical modelling (Maxwell & Condon, 2016; Fatichi & Pappas, 2017).
The main difficulty with our approach is that we do need the information on observed soil moisture which we do not have for many of the FLUXNET sites. However, there is a way around that by using the daily mean Evaporative Fraction LE/(H+LE) which has the advantage that it can be used at any site. We now have estimates of T:ET for all FLUXNET sites and AmeriFlux datasets.
Rodolfo Nóbrega: Optimal root zone capacity from a hydrological perspective (and with hydrological implications)
The idea of optimised water storage has been around for a long time. In 1883, Rippl designed the mass balance curve method to design the capacity of surface water reservoirs based on cumulative water deficits. This same concept has been, more recently, applied in hydrological models to quantify the water storage created by plants’ root zone (e.g., Wang-Erlandsson et al., 2016). We have been using this method with a modification for climatological seasonality to derive water stress factors for photosynthesis (https://doi.org/10.5194/egusphere-egu21-3480).
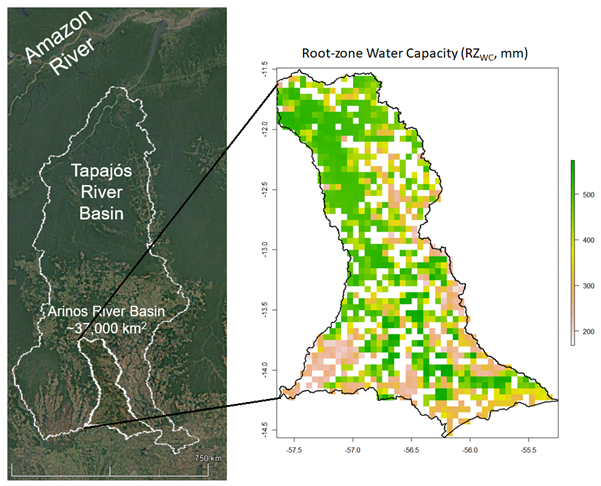
By extracting the respective root zone water capacity (RZwc), we have mapped the changes in root zone storage due to land use changes. As part of the integration of this approach into a hydrological model, we have been analysing, for example, how is the time between changes in RZwc and other hydrological fluxes. For this exercise, we have selected a watershed within the Amazonian River basin that has been under intense deforestation and land-use change (figure below).
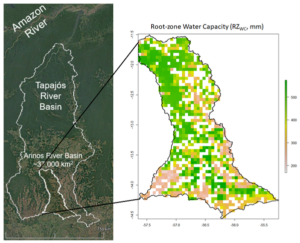
Figure 3. Root-zone water capacity of an area on the Amazonian River Basin
We constructed a time series with both RZwc and baseflow and applied a breakpoint residual trend analysis that removed the effects of precipitation on baseflow trends. Our preliminary results show that both RZwc and baseflow breakpoints had similar timing. Following the logic behind the physical processes in a watershed, one would expect to see a disruption in the RZwc followed by a change in river discharge. This is exactly what happened around 1995, 2000, and 2005 (figure below). However, this did not happen in 1990, despite a continuous decrease in RZwc between 1985 and 1990. We suspect that land use changes during that period were slow-paced, and the breakpoint detection could not identify the real impact of RZwc changes on hydrological fluxes. We will test this and other hypotheses in our next steps, which include the application of other optimality theories.
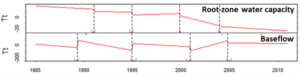
Figure 4. Time -series for the root-zone water capacity and baseflow rates in the Amazonian River Basin
Huiying Xu: Global variation in the ratio of sapwood to leaf area explained by the optimality principle
The Huber Value, VH, is the ratio of sapwood area to leaf area. How plants allocate their resources to sapwood and leaves has a large influence on the land carbon and water cycles. In DGVMs, these allocations are treated as fixed values or empirical functions, without considering how they coordinate with other physiological processes. It is important to understand how and why plants differ in their allocation strategy along geographic climate gradients.
In our study, we developed a model hypothesis with optimal sapwood: leaf area (based on Whitehead et al.,1984) where it is assumed that the water supply through the stem (Darcy’s law) equals the water loss via leaf/stomata (Fick’s law). For the water supply, we also used the compensation effect of hydraulic efficiency (Ks) and the driving force of difference between the water potential of the leaf and soil (ΔΨmax). From the water demand perspective, we hypothesized that the photosynthetic traits determine CO2 fixation, hence water demand. It has been proven that the VH is related to the leaf’s internal CO2 (Ci) and Vcmax (Xu et al., 2021) and we can use the least-cost hypothesis and the coordination hypothesis to represent the Ci and Vcmax respectively.
To test our hypothesis at the global scale we used the species-level hydraulic trait database with 1727 species in total over 48 sites according to three climate variables. We applied multiple linear regression with 5 driving factors of the VH at the site level and compared the observed and our model prediction. There was an insignificant effect of ΔΨmax which may be explained by the significant negative relationship between Ks and ΔΨmax and also uncertainties in the Ψsoil variation.
We removed these uncertainties and repeated the multiple linear regression without ΔΨmax and we observed VH response to climate and its relationship with Ks matches our theoretical prediction.
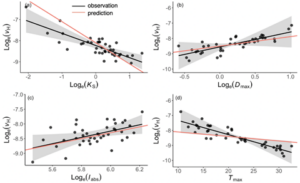
Figure 5. The partial residual plot of the relationships between VH and its driving factors. Ks is sapwood conductivity, Dmax is the maximum vapor pressure deficit, Iabs is irradiance and Tmax is the maximum temperature during the growing season. The black dots are site-mean values, black lines are fitted, and red lines are predicted sensitivities.
The comparison between the observed and our predictions confirms the hypothesis that plants allocate resources optimally to balance the water supply and water demand. Our model predicts VH variation with only a single parameter, Ks (explaining 45% of the VH variation) and we have also shown that temperature and VPD have opposing effects on VH and plant allocation strategies.
It would be good to incorporate this into the DGVMS to improve plant allocation to leaf and stem and consider the underlying traits coordination by using just a single fitted parameter without the need for calibration. Thus, our hypothesis is accurate and easy to incorporate into DGVMs without increasing model complexity. It also improves the modelling of plant hydraulic efficiency as the VH is easier to measure than Ks.
Colin’s REALM team also recently had a meeting to discuss their research on the theme of global ecohydrology. You can read more about that work here: https://prenticeclimategroup.wordpress.com/2022/11/18/global-ecohydrology/