Benjamin Stocker
Root zone water storage capacity (S0) is related to the rooting depth and the availability of water holding capacity across a soil profile. It is an important property in determining ecosystem photosynthesis and evapotranspiration in rain-free periods and controls the sensitivity of ecosystems and their carbon and water fluxes to drought conditions. While S0 is an essential parameter of land surface models, it is almost impossible to measure in the field, at least not across large scales. Considering that S0 is also highly variable across small spatial scales and that it varies massively between species and between different biomes, it is really a sort of elephant in the room for large-scale drought impacts modelling.
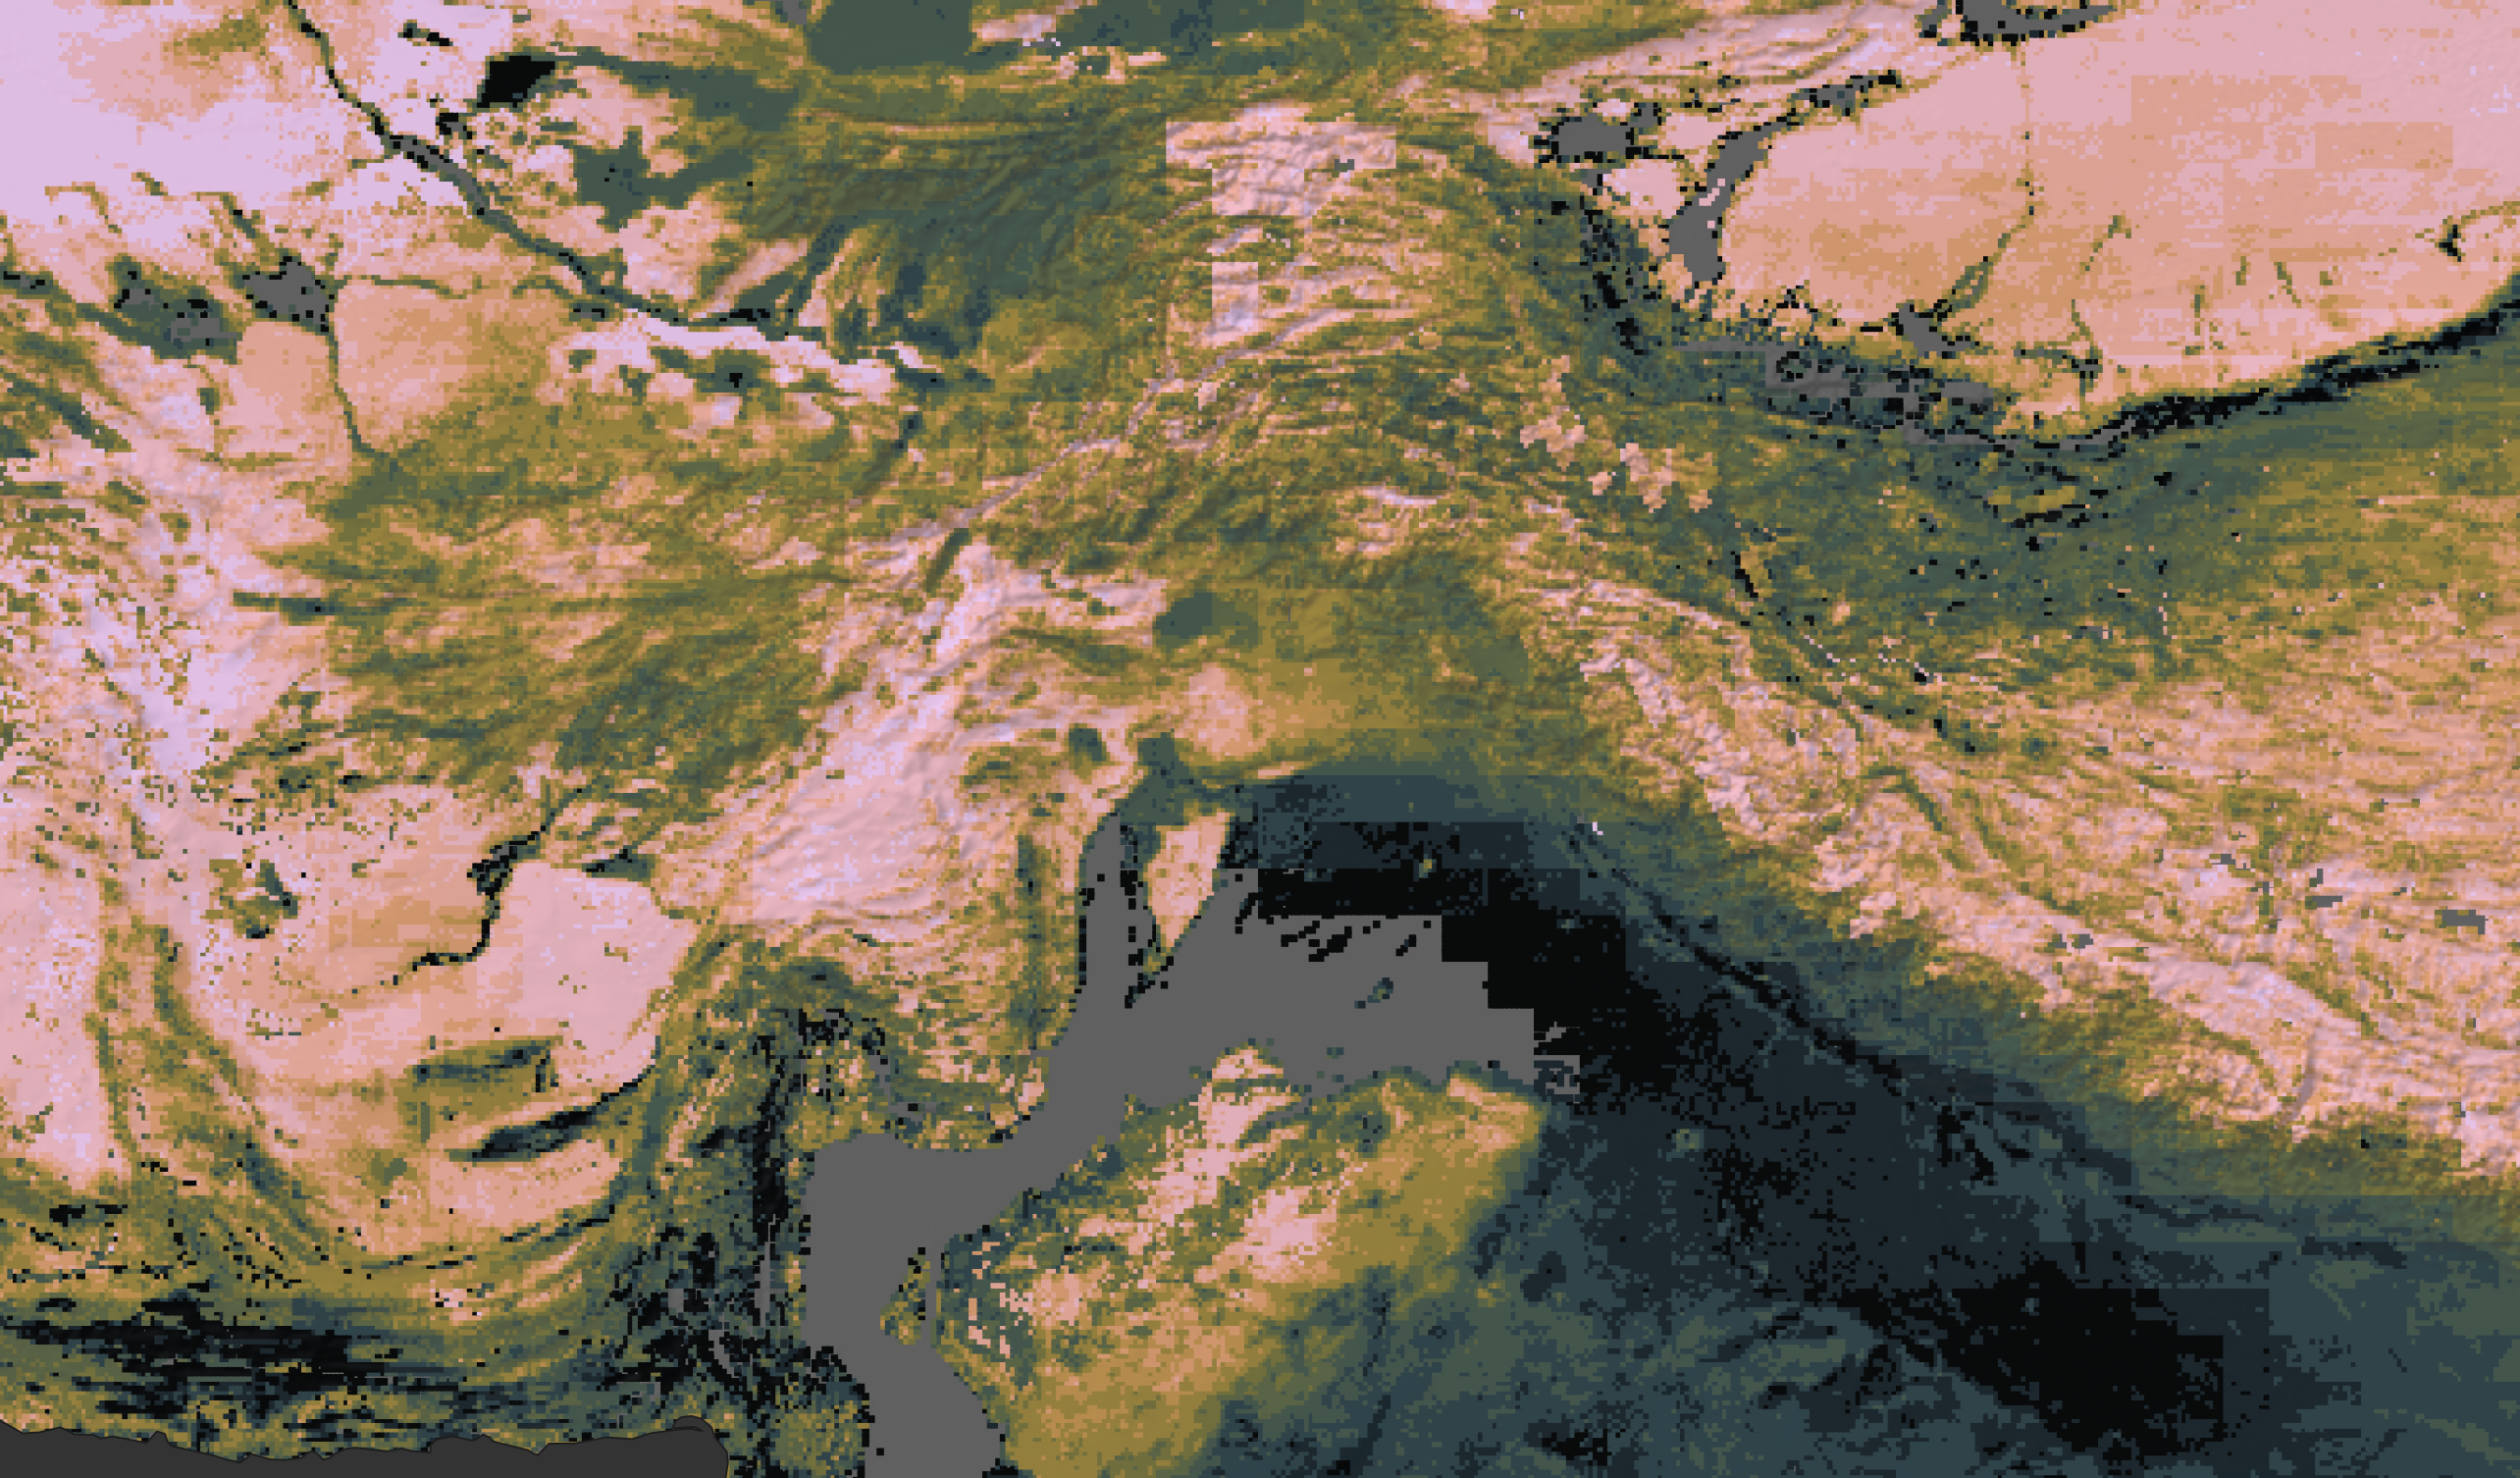
Previous studies have estimated the root zone water storage capacity based on a water mass balance approach where the parallel time series of evapotranspiration (ET) and precipitation (P) are considered (e.g., Gao et al., 2014). This approach was also the starting point of our analysis, which has been published today in Nature Geoscience. Using remote sensing and climate reanalysis data, provided at ~5 km resolution, we derived continuous daily time series of the cumulative water deficit (CWD) over the years 2003-2017 for each pixel across the globe. Knowing how much water is lost from the land surface during dry periods is key for estimating how much locally stored water plants have access to. With this rationale, we calculated a first estimate for the global distribution of S0 , informed by extreme values of annual CWD maxima in each pixel.

It should be noted that a key ingredient to such diagnosed S0 estimates is the ET data. The challenging aspect is that most remote sensing-based ET products make an assumption about S0 – either directly or indirectly – for determining the sensitivity of ET to drying of the soil. Of course, when using such ET products, the diagnosed S0 just reflects assumptions embodied in the algorithm used for estimating ET. There is a clear risk for circularity. This made us search for ET estimates that are free of such an assumption. As an additional help in guiding our search for a suitable ET estimate was its performance when evaluated against local measurements. Our search identified a clear winner: ALEXI-ET (Hain & Anderson, 2017). Instead of relying on an a priori specified water stress function, it makes use of information gleaned from surface temperature remote sensing and parallel climate reanalysis. The ALEXI algorithm thus infers ET from the surface and atmospheric energy budget. Furthermore, our evaluation of different remote sensing-based ET products revealed that ALEXI-ET yields ET estimate that exhibits no systematic bias with the level of water stress – in contrast to the alternatives we tested. This gave us the confidence to move ahead.
The next question we addressed was whether the CWD maxima reflect root zone dimensions or (just) the hydroclimate. Interpreting apparent CWD maxima as a reflection of the rooting depth implicitly assumes that the actual rooting zone water storage capacity is just large enough and roots just deep enough to yield the apparent water deficits in the dry season. Given the opportunity costs of building deep roots, such a sizing would be optimal from an eco-evolutionary perspective. To test whether this is the case, we looked at the vegetation activity and analyzed how it responds to water deficits. As a measure of vegetation activity, we focus on sun-induced fluorescence (SIF), normalized by incident solar radiation, and on the evaporative fraction, defined as ET divided by net radiation. Regressing vegetation activity against CWD yields information about the sensitivity of vegetation to water stress from which we estimated the CWD at which vegetation activity ceases. If this “cessation CWD” agrees with the magnitude of CWD extremes, we have a further indication that roots are indeed just deep enough to get the water needed to sustain rare drought events. And indeed, we found a close correspondence between the two quantities.
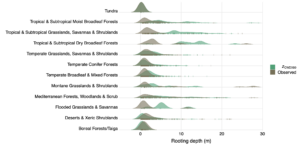
As a further test of our remote sensing-based S0 estimates, we made use of a recently published comprehensive compilation of field data of rooting depths from over 5000 individual field observations across the globe and covering all major biomes (Tumber-Davila et al., 2022). Also at this scale, we found consistent patterns. The deepest roots are found where seasonal water deficits are largest and the shallowest roots are found in climates where annual CWD maxima are small. Interestingly, the largest root zone water storage capacities and rooting depths are diagnosed from space and observed in the field, not in the driest climates, but in monsoonal climates and biomes with perennial plants and where (more or less) green vegetation cover is maintained throughout the year. In contrast, vegetation pursues an “ephemeral” strategy in the driest climates – relieving the necessity of rooting excessively deep for maintaining activity. This is probably also an expression of an optimal balancing of trade-offs – investing in deep roots is only a viable option if it is not outweighed by the costs of rebuilding leaves.
Apparent cumulative water deficits, the sensitivity of vegetation activity to dry conditions, and the rooting depth of plants converge to consistent patterns. The implications of these insights are manifold. First, we now have information about the global distribution of the apparent rooting zone water storage capacity which can be used to better parametrise land surface models. This may be useful for removing persistent bias in ET simulations (Ma et al., 2018). Second, our maps document large variations of S0 across multiple scales – across the Earth’s biomes, across land uses (irrigated croplands emerge as hotspots of water losses), and across topography (larger water losses along rivers and deltas than in flat upland areas). This insight is enabled by the high spatial resolution of our global-scale analysis. Third, and maybe most strikingly, our estimates of S0 suggest that plants source more water than can be stored in two meters of soil across a third of the Earth’s surface. We don’t know the soil depth across the globe very well. Models have to rely on assumptions and commonly use prescribed rooting depths. The picture drawn from our S0 estimates and from other emerging research (Rempe et al., 2018 ; McCormick et al., 2021) is that plant-accessible water stores are surprisingly large in many places and that water stored in the weathered bedrock groundwater probably plays a more important role in regulating the land-atmosphere exchange of water vapour and photosynthesis than is currently appreciated and considered in land surface and Earth system models.
You can read the full paper here
Stocker, B.D., Tumber-Davila, S.J., Konings, A.G., Anderson, M.B., Hain, C. and Jackson, R.B. 2023. Global distribution of the rooting zone water storage capacity reflects plan adaption to the environment. Nature Geoscience, https://www.nature.com/articles/s41561-023-01125-2,
## Data download
Global datasets of cumulative water deficit maxima and apparent rooting depth are available on [Zenodo](https://doi.org/10.5281/zenodo.5515246) as NetCDF files.
## Open access code
Code is available from GitHub repository [`mct` at tag v4.0](https://github.com/computationales/mct/tree/v4.0), published on Zenodo with DOI [10.5281/zenodo.7429129](https://doi.org/10.5281/zenodo.7429129).
The algorithm to derive cumulative water deficit time series and a list of water deficit events (consecutive days with a negative water balance), is made available as an [R package from our GitHub repository](https://github.com/computationales/cwd), published on Zenodo with DOI [10.5281/zenodo.5359053](https://doi.org/10.5281/zenodo.5359053).
## Global map as poster