Whilst there are decades of global, remotely sensed data on vegetation cover, biomass and photosynthetic activity, reliable and more accurate models will not emerge from data analysis alone. Most data on plant responses to climate change scenarios have come from large facilities such as Free Air Carbon Enrichment (FACE) experiments, which have been instrumental in model development. But to test new theories, like EEO (Eco Evolutionary Optimality), we need new data from targeted experiments.
We have a team of experimental scientists working on developing more data to quantify plant carbon allocation and trait responses to CO2, water, N and P. They are also developing experiments to assess the relationship between nitrogen and phosphorus supply and demand for different nutrient acquisition strategies (mycorrhizal types and nitrogen-fixers). This work is done in both laboratories and in the field.
In our LEMONTREE October science meeting, we heard from members of the experimental team about their recent research on the A/Ci curve. The A/Ci curve is the relationship between the photosynthetic CO2 assimilated into the plant structure (A) versus the CO2 inside the plant (Ci). From these curves, we can obtain the maximum rates of carboxylation (Vcmax) and electron transport (Jmax).
Introduction to measurements.
Hugo de Boer (Utrecht University)
The A/Ci Curve. This is the photosynthetic response to changes in the leaf interior CO2 concentrations which can be used to derive parameters of Vcmax and Jmax. It is based on the Farquhar, von Caemmerer & Berry (FvCB) model of photosynthesis for the relationship between net photosynthesis (A) and leaf-interior CO2 concentration (Ci) and limitations due to maximum rates of carboxylation (Vcmax) and electron transport (Jmax). However, Ci cannot be (easily) measured directly as it is occurring inside the leaf.
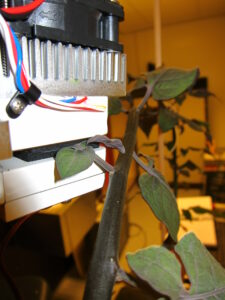
To conduct these experiments and develop the curves, we use LI-COR readers, either LI6400XT or the newer LI6800. These are portable photosynthesis measurement devices which provide measurements based on leaf gas exchange on single leaves in a closed cuvette. This allows us to change environmental conditions, e.g., light, temperature, humidity, and CO2 to measure the changes in gas exchange. Concentrations of water vapour and CO2 are measured by IRGAs (infrared gas analysers) in two air streams: Reference (unaffected by the leaf) and Sample (with CO2 and water vapour altered by the leaf). Using the difference between the sample and reference concentrations and the known leaf area, we can calculate the photosynthesis and respiration rates. The measurement of Ci is based on measurements of both water vapour and CO2 fluxes and Tleaf.
Protocol
- Measurements are conducted between sunrise and midday to ensure stomata are open and plants are not stressed.
- Select saturating light levels (preferably based on light-response curves)
- Cuvette temperature and humidity should not induce stress and induce stomatal closure
- Take steady-state measurements at a range of Ca setpoints.
- Fit the FvCB model to the measurements
Uncertainties and Limitations
- It is a time-consuming process, taking 30-60 minutes per A-Ci curve on the older LI6400XT machine, the newer LI6800 can be much faster with approximately 15 minutes per curve.
- The stomata need to be open to do this, meaning you cannot really do this on stressed plants.
- Measurements of Ci represent the location of Ci at the site of evaporation, not in the chloroplast.
- TPU-limitation is typically not fitted in our protocols but can be fitted if needed to the measured A-Ci curves for model input if needed.
- Typically, the effects of mesophyll conductance (gm) are ignored, however, we know that this can change at different timescales and these changes are attributed to changes in Vcmax and Jmax.
- Short-term biochemical downregulation due to accumulations of non-structural carbohydrates is also attributed to Vcmax and Jmax.
- Temperature effects on Vcmax and Jmax are commonly modelled to obtain temperature-normalised values for 25°C, e.g., Vcmax25 and Jmax25. The results are different depending on the modelling approach used.
It is important to note that not all values on Vcmax and Jmax in the literature (or TRY database) have been based on gas exchange measurements, some are based on Rubisco or chlorophyll content or SIF (Solar Induced chlorophyll Fluorescence) signals.
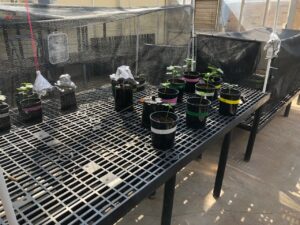
Acclimation of photosynthetic biochemistry to the soil environment.
Jan Lankhorst (Utrecht University)
In Jan’s greenhouse experiment, plants were grown in two soil treatments (natural and sterilised) and three sand nutrient treatments (low, medium, and high) to mimic naturally available nutrient levels for nitrogen and phosphorous. Two species were used for each treatment, a grass (Holcus lanatus), and a vine (Solanum dulcamara). To measure the gas exchange a Li- 6400 with a 6cm2 chamber was used.
Treatment plan used for both grass and vine:
| Soil | Sand | |||
| Natural | Sterilised | Low nutrient (Mainly focussed on N & P) load (0.7* soil available concentration) | Medium nutrient load (1* soil available nutrient concentration) | High nutrient load (2* soil available nutrient concentration) |
Results
There was a significantly stronger reaction in Vcmax for the grass species between the various nutrient treatments, compared to the vine, which did not show a similarly strong reaction in its photosynthetic parameters with treatments.
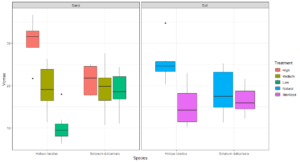
For the grass, Vcmax was much higher than in the natural soil than in sterilised soil. This reaction was again less strong for the vine. Additionally, the treatment of sand with a medium nutrient load had similar photosynthetic properties as the grass grown in the soil treatments. For both species grown in the soil treatments, there was a nice linear relationship between Vcmax and Jmax.
It was assumed prior to the experiment that the sterilised soil treatment would provide a similar amount of readily available nutrients as the medium sand treatment. Additionally, it was assumed that the natural soil treatment would still have a functioning N-cycle making inorganic nitrogen available for the plants, resulting in natural soil treatments outperforming the medium nutrient treatment in the sand. This was not the case.
Another interesting observation for the vine was the contrasting patterns in biomass between the soil and sand treatments. However, these are also preliminary results and observations that require statistical analysis is still required once Jan returns to the Netherlands from the University of Western Australia. You can read more about Jan’s experimental work on biomass allocation that he has been conducting at the UWA this summer in his blog.
Photosynthetic acclimation responses to CO2 across a soil nitrogen availability gradient.
Evan Perkowski (Texas Tech University)
Evan presented his new results from a growth chamber experiment where soybeans were grown in a full-factorial combination of the following treatments:
- Nine different soil nitrogen concentrations (0, 35, 70, 105, 140, 210, 280, 350, 630ppm N)
- Two CO2 concentrations (ambient- 420ppm CO2 and elevated- 1000ppm CO2).
- As soybeans are legumes, half of the plants were inoculated with nitrogen-fixing bacteria (BNF), with the remaining half left uninoculated.
Results
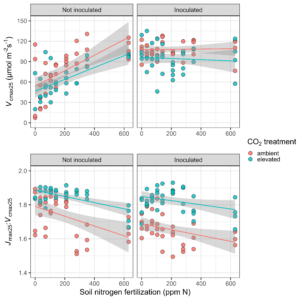
In response to elevated CO2, we expected to see a downregulation of Vcmax25 regardless of the soil nitrogen or inoculation status. We found confirmation of such patterns, where Vcmax25 was generally lower in plants grown under elevated CO2. Interestingly, we also found a strong positive effect of soil nitrogen fertilization on Vcmax25 in non-inoculated pots, however, no apparent effect of soil nitrogen in pots that had been inoculated with nitrogen-fixing bacteria.
We speculate that this was driven by a reduction in the cost of acquiring nitrogen through direct uptake with increasing nitrogen fertilization, but we will need to finish up a few tasks in the lab to deduce mechanisms that are driving these responses.
Photosynthetic acclimation along an elevational gradient.
Brad Posch (Texas Tech University)

In July 2022, the experimental plant physiology group from TTU, spent 10 days at the Rocky Mountain Biological Lab in Colorado to test the EEO along an elevational gradient. Using six sites that ranged from 2500m- 3400m, we measured the most abundant species at each site (a total of 23 species) and measured dynamic A/Ci curves (using the LI- 6800) to obtain Vcmax and Jmax.
Results
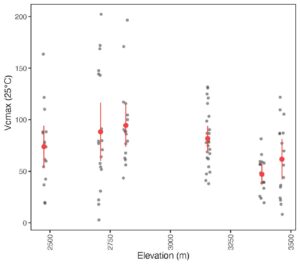
The P-model and optimality theory predicts that if we go up in elevation, we will see an increase in Vcmax. The results from this study showed that whilst Vcmax increased initially up to an elevation of 2800m, it then declined as the elevation increased further to 3400m. This is not what we expected to see. However, the Jmax:Vcmax ratio increased with elevation.
We are still working through the analysis and have not built in the climate data for these sites yet, which varies considerably with elevation. As well as becoming cooler at higher elevations, our six sites are also generally wetter as elevation increases. This is not necessarily the typical pattern you would see with increasing elevation at other locations. This could be an explanation as to why we see Vcmax declining at higher elevations.
You can read more about the fieldwork that Brad and the TTU team undertook this summer here.
Acclimation of photosynthetic biochemistry to light availability.
Nick Smith (Texas Tech University)
In this light manipulation study, we grew plants in a greenhouse under the following treatments:
- Four light treatments (0% shading to 80% shading)
- Four soil nitrogen fertilisation treatments (0, 70, 210 and 630ppm nitrogen)
- Two species (cotton and soybean)
We took measurements for A/Ci curves, leaf chlorophyll, LMA, N, whole-plant carbon and nitrogen allocation.
Results
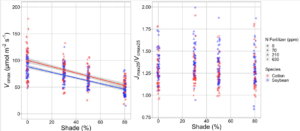
Focussing on A/Ci curves, as we increased the light availability, both Vcmax and Jmax increased. This was regardless of fertiliser treatment or species. Furthermore, the changes in Vcmax were proportional to the changes in Jmax, so the ratio stays the same. This tells us that shading reduces the plant’s investment in photosynthetic biochemistry in line with what we would expect to see.
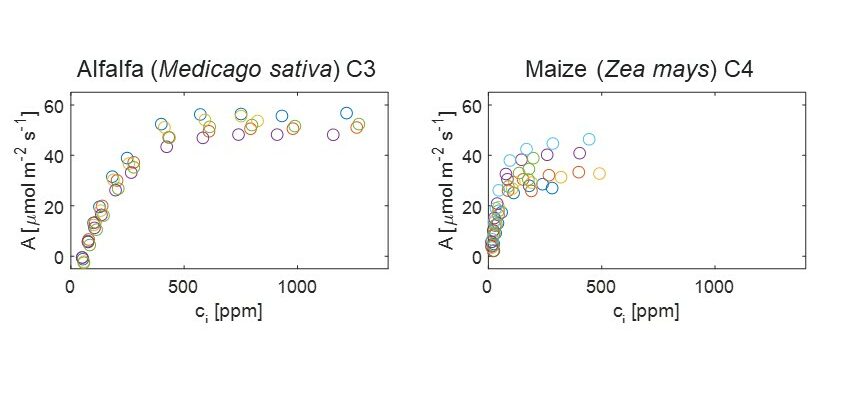
Responses of C3 and C4 plants to atmospheric CO2.
Paul Drake (University of Western Australia and Utrecht University)

We have conducted experiments to look at the physiological adaptations of C3 and C4 grass species after they have been grown in different CO2 and water treatments.
The key question for the LEMONTREE project is: does β differ between C3 and C4 species? And if so, is there any interaction between the atmospheric CO2 concentration (Ca) and water deficit?
Panicum grasses (both C3 and C4 species) were germinated at either 400ppm CO2 (ambient) or 1000 ppm CO2 (elevated) and were then transplanted into pots and either watered daily or experienced a 3-day per week deficit of water treatment.
Results
For the well-watered treatments, i.e., those plants that were watered daily, initial results show that Vcmax differed between the C3 and C4 species but there was not a clear response to their atmospheric CO2 treatment. However, these are provisional results and need to be confirmed to have more confidence in this result.

In the elevated CO2 treatment, there was a reduction in the operational stomatal conductance, in both C3 and C4 species, which is surprising. Also, the effect of elevated CO2 on the operating photosynthetic rate is greater in the C3 species than in the C4 species due to the nature of the relationship between A and Ci for the different biochemical pathways.
Finally, Vcmax/gop differed between species and between CO2 treatment for the C3 species of P. bisculcatum.