For decades, vegetation models have described photosynthesis using temperature response curves derived from the Farquhar model. These curves typically assume that parameters such as Vcmax and Jmax respond to temperature in fixed, prescribed ways.
But we know observations tell a different story.
Across species and ecosystems:
- The thermal optimum of photosynthesis (Topt) increases when plants grow in warmer conditions.
- The maximum assimilation rate at that optimum (Aopt) often declines at high growth temperatures.
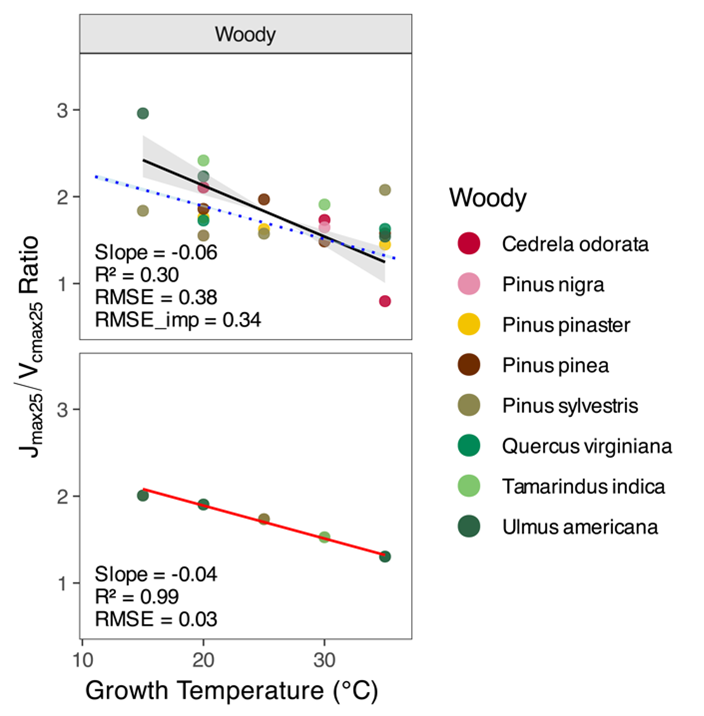
- The ratio of Jmax25 to Vcmax25 decreases with warming.
In other words, plants acclimate. But how plants adjust their photosynthesis to long-term changes in temperature isn’t fully understood. Most large-scale models account for this issue using empirical adjustments, for example by allowing activation energies or entropy terms in Arrhenius equations to vary with growth temperature. These approaches improve the model output, but they require parameter fitting and often differ by plant functional type (PFT).
But a core question remains: Why does Topt shift with growth temperature? What mechanism explains this acclimation? A new paper led by LEMONTREE PhD student, Wenyao Gan entitled “An eco-evolutionary optimality model explains the acclimated temperature response of photosynthesis” in New Phytologist tackles this issue.
An eco-evolutionary optimality approach
Wenyao’s study addresses this using the sub-daily P-model, built on eco-evolutionary optimality (EEO) theory. Rather than prescribing how photosynthetic parameters should change, the model assumes that plants adjust traits to maximise carbon gain relative to costs under prevailing environmental conditions. These adjustments emerge dynamically from environmental drivers such as temperature, light, vapour pressure deficit (VPD) and CO₂.
In this framework:
- The ratio of electron transport capacity (Jmax25) to carboxylation capacity (Vcmax25) adjusts optimally.
- Stomatal behaviour adapts in coordination with photosynthetic capacity.
- No empirical temperature-dependent tuning parameters are required.
What we wanted to know is whether this optimality framework can reproduce the observed thermal acclimation and the answer is yes!
Model simulations show that under high light, Topt increases strongly with growth temperature from ~25°C when plants grow at 10°C to ~38°C when they grow at 40°C.
Crucially, this shift is not imposed. It emerges from changing balance between the Rubisco-limited rates (Ac and Aj) and electron-transport limitation (J)
At cooler growth temperatures, the temperature optimum of photosynthesis often lies in the electron transport–limited regime. As growth temperature rises, the relative balance between these two limitations shifts. Because Jmax25 declines relative to Vcmax25 under warming, the switch between Aj and Ac occurs at higher instantaneous temperatures. The result is a rightward shift in Topt.
This means Topt is not determined by a single biochemical parameter. It is an emergent property of coordinated adjustments between electron transport, carboxylation and stomatal conductance.
The model also reproduces the observed decline in Jmax25/Vcmax25 with warming — a pattern long reported in experiments but poorly explained mechanistically.
Observations across scales
The study compares simulations against two major data sources: Leaf-level gas exchange experiments (woody and non-woody species) and ecosystem-scale flux tower measurements (FLUXNET sites)
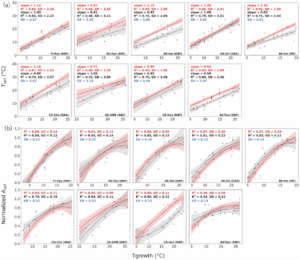
At the leaf level:
- Observed Topt increases with growth temperature, especially in woody species.
- The model reproduces this positive relationship with strong agreement.
- The observed peaked relationship between normalised Aopt and growth temperature is also captured.
At the ecosystem scale:
- Across sites in Europe, North America and Australia, Topt derived from flux data increases by roughly 0.75–1.1°C per 1°C rise in growth temperature.
- The model predicts very similar sensitivities.
- The scatter around the relationship closely matches observations.
Importantly, sensitivity tests show that using air temperature instead of leaf temperature at flux sites has negligible influence on the estimated Topt for the predominantly well-watered, temperate sites analysed.
Together, these results demonstrate that acclimation is visible not just at the leaf scale under controlled conditions, but also at whole-ecosystem scale in real-world data. Using the sub-daily P model, it produces acclimation as a natural outcome of optimal coordination between photosynthetic processes and stomatal behaviour. No extra temperature-dependent tuning is required.
This is particularly important for next-generation land-surface models such as JULES, where Wenyao’s broader PhD work focuses on implementing eco-evolutionary optimality formulations for photosynthesis and primary production, dark respiration and stomatal behaviour.
For Wenyao, this first PhD-led paper lays the foundation for integrating these ideas directly into JULES. For LEMONTREE, it represents another step toward land-surface models that predict plant responses mechanistically, rather than tuning them retrospectively.
“This paper was actually an unexpected outcome. Our original plan was simply to incorporate the P-model into JULES, but during comparisons with the original JULES photosynthesis scheme we noticed an interesting pattern in thermal acclimation. Following that led to this study”
Wenyao Gan- PhD Student at the University of Reading (Supervised by Prof Sandy Harrison & Prof Pier Luigi Vidale)
You can read the paper here:
Gan, W., Alizadeh, N., Best, M., Vidale, P.L., Prentice, I.C. & Harrison, S.P. (2026). An eco-evolutionary optimality model explains the acclimated temperature response of photosynthesis. New Phytologist. https://doi.org/10.1111/nph.71062