The focus for our June Science meeting, was phenology and phenological strategies as part of Challenge 1: Optimality at the leaf and plant levels, where we plan to develop a comprehensive “optimal trait theory” predicting the leading dimensions of variation in the functional morphology of plants.
Change in phenological events is one of the clearest indicators of climate change and there are already significant changes being seen in the natural world, from leaves and flowers appearing earlier, earlier phytoplankton blooms in lakes and oceans, earlier departure of migratory birds in spring/ later migration in autumn and earlier appearance of mammals from winter hibernations. Altered phenological patterns can drastically impact trophic interactions and led to ecosystem imbalance.
Understanding how phenological events may change with climate change is therefore timely (pun intended). Indicators from trees such as leaf out in spring and leaf fall in autumn can help us build a better understanding of our changing climate and how we can model this.
In our meeting, we heard updates on their research from four team members who are working on phenological projects as part of LEMONTREE.
PREDICTING LEAF AREA INDEX AT PEAK SEASON AND ITS ENVIRONMENTAL CONTROLS WITH A NOVEL CONSTRAINT EEO FRAMEWORK.
Ziqi Zhu (Tsinghua University, LPICEA, Supervisor Dr Han Wang)
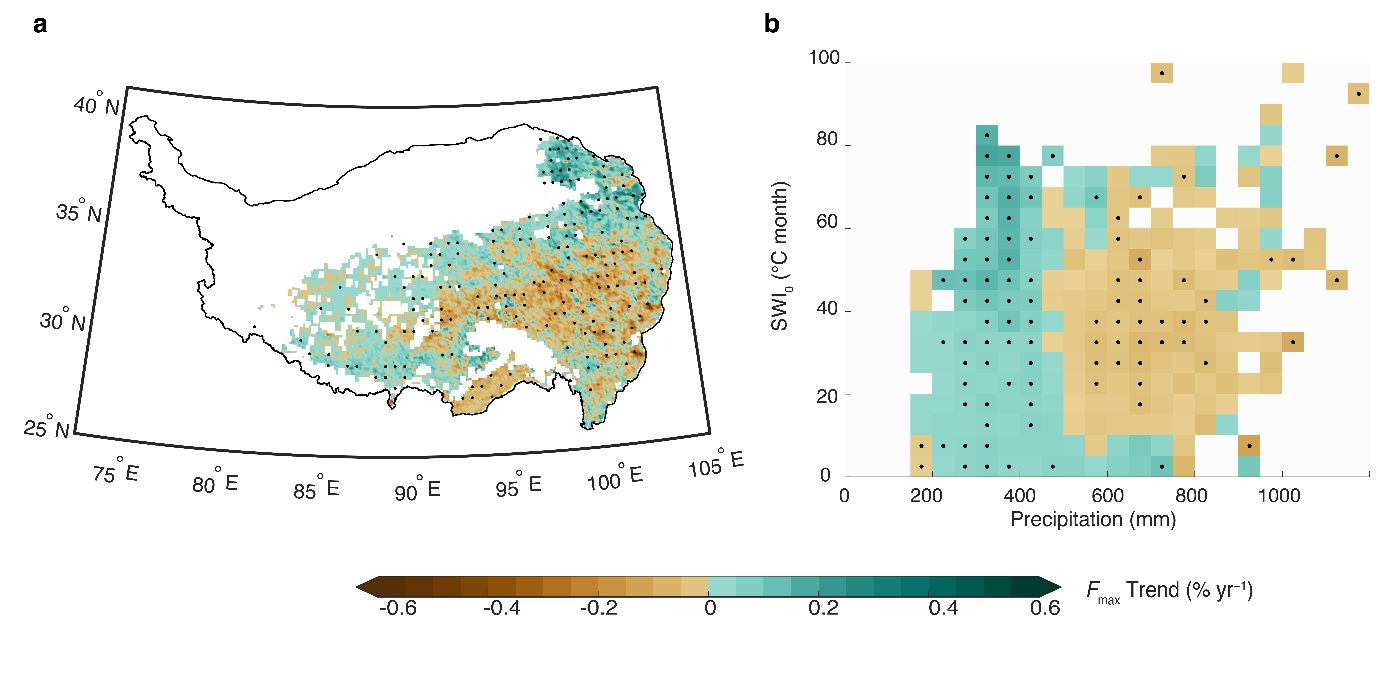
Recent increases in vegetation cover, observed over much of the world, reflect increasing CO2 globally and warming in cold areas. However, the strength of the response to both CO2 and warming appears to be declining. Here we examine changes in vegetation cover on the Tibetan Plateau over the past 35 years.
Although the climate trends are similar across the Plateau, drier regions have become greener by 0.31±0.14% yr−1 while wetter regions have become browner by 0.12±0.08% yr–1. This divergent response is predicted by a universal model of primary production accounting for optimal carbon allocation to leaves, subject to constraint by water availability.
Rising CO2 stimulates production in both greening and browning areas; increased precipitation enhances growth in dry regions, but growth is reduced in wetter regions because warming increases below-ground allocation costs. The declining sensitivity of vegetation to climate change reflects a shift from water to energy limitation.
DOES INCREASING GROWING SEASON PHOTOSYNTHESIS REALLY LEAD TO LEAF SENESCENCE.
Xinchen Lu (University of California, Berkely, supervisor Prof Trevor Keenan)
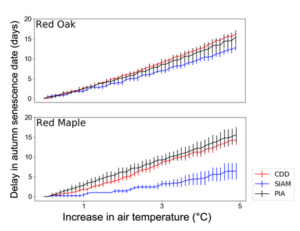
Xinchen gave a talk on his recent research that examined the relationships between growing season photosynthesis and end of growing season (EOS). Using observations from 40 eddy-covariance flux tower sites in temperate and boreal ecosystems in the northern hemisphere with more than 10 years of observations (594 site-years). Additional ground observations of phenology, satellite observations from the Moderate Resolution Imaging Spectroradiometer (MODIS), and three leaf senescence models were used to test the extent of a relationship between growing season photosynthesis and end of season senescence.
The results suggest that there is no significant negative relationship between growing season photosynthesis and observed leaf senescence, flux-inferred EOS estimates, or remotely sensed phenological metrics, in most ecosystems. On the contrary, while they found negative effects of summer air temperatures and autumn vapor pressure deficit on EOS, more productive growing seasons were typically related to a later, not earlier, EOS. Their results were recently published in Global Change Biology (https://doi.org/10.1111/gcb.16104).
FIRST STEPS TOWARDS A GLOBAL PHENOLOGY MODEL USING PHENOCAM DATA
Boya Zhou (Imperial College London, supervisor Prof Iain Colin Prentice)
Boya introduced a new global phenology model simulation scheme based on eco-evolutionary optimality theory, and the feasibility of testing this model with the Phenocam database. Leaf phenology is closely related to photosynthesis as reflected by gross primary productivity (GPP). On the one hand, GPP is dependent on leaf area index (LAI) because leaves are essential for photosynthesis. On the other hand, GPP determines the carbon allocated to leaves because plant leaf phenology strategies are to gain a competitive advantage in photosynthesis.
Under an unchanging environment, these two processes will eventually reach a steady state, at which point LAI and GPP should show a linear relationship. This linear relationship, together with a simple light use efficiency algorithm of MOD17, could form a closed set of equations about steady-state LAI and GPP.
A semi-prognostic phenology model was developed by Xin et al. (2020), which simulates the time series of vegetation LAI but requires the input of maximum satellite LAI data. Boya’s study aims to improve the existing semi-prognostic phenology model in two aspects:
- Try to ‘combine’ this semi-prognostic phenology model with our maximum LAI model, which can predict seasonal maximum LAI independently thus can be treated as an input to the phenology model.
- Replace the light use efficiency algorithm it involved with our P model.
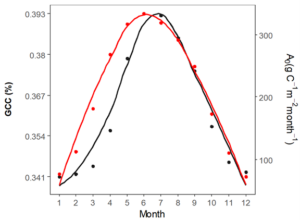
The new global phenology model will be evaluated and improved using data on vegetation greenness as ‘targets”. The preliminary analysis based on Vegetation Greenness/GCC (Green Chromatic Coordinate) and A0 (Potential Gross Primary Production) indicates that GCC has similar seasonal variation trends to A0, even though it consistently lagged A0 in spring and summer. In addition, the phenological prediction in evergreen broadleaves forests remains a major uncertainty.
Changes in plant phenology will affect several aspects of ecosystem functioning, including evapotranspiration. The final presentation of the morning was from Amin Hassan to present his research on partitioning evapotranspiration at the catchment scale.
INVESTIGATION OF PARTITIONING ET BASED ON THE BUDYKO CONCEPT.
Amin Hassan (University of Pittsburgh, supervisor Prof Xu Liang)
Partitioning evapotranspiration (E) into its components has been an important subject of research. Uncertainty remains in the determination of transpiration, interception, and bare soil evaporation. This research aims to estimate the ratio of transpiration to total evapotranspiration (T/E) using hydrological observations at the catchment scale.
A formula was developed based on the Generalized Proportionality Hypothesis (GPH) and plant root distribution in the topsoil layer to find the ratio T/E. 180 watersheds from the HYSETS dataset were used to evaluate the derived formula. E, potential E, and change in soil water storage data were collected from the GLEAM dataset. Precipitation data were retrieved from the MSWEP dataset. Plant root distribution values were obtained from. Observed T/E values obtained from FLUXNET eddy covariance measurements were used to validate the derived formula in partitioning T/E.
Our initial results illustrated good agreement between the simulated and observed mean T/E values for forests and shrubs, with a slight underestimation in grass watersheds. This new method shows good potential for determining the transpiration ratios using hydrological observations at the catchment scale.
Team discussion
There are two main tasks that we plan to address concerning phenology in the LEMONTREE project. The first of which ‘Prediction of the distribution of deciduous versus evergreen dominance, from optimality principle’ using temperature and drought as indices. This work is being led by Dr Han Wang at Tsinghua University and the work is almost complete. Therefore, our discussion after the presentations focused on the second task to ‘develop a unified approach to predict the phenological triggers for leaf-out and leaf-fall in cold and drought deciduous plants’ which is being led by researchers at the University of Reading.
The team discussed triggers using an eco-evolutionary optimality concept and how to predict them non-empirically. However, it was agreed that before this, the pressing need is to really understand what these phenological events look like in the real world using real data before we can hypothesize optimal predictors of triggers.
Boya will soon be exploring the apparent lag between what we see in current models and what we observe in nature, particularly for the start of the season, the leaf-out and whether a better indicator could be peak greenness rather that the start and end of growing season which is something the LEMONTREE LAI working group are currently working on.
To create a unified approach to predicting phenology events, the team plan to explore 2 approaches to data:
- Remote Sensing
- Site level data from
- Phenocam
- Flux towers
By taking these various data sources into account, we can overcome the limitations of each and validate the various components of the model, then use an experimental approach to test the different mechanisms.
As you can see, we are already under way with addressing phenological data analysis. The next steps will then be model code availability, which we hope to have completed by the end of year 2, and testing the model, which we will undertake in year 3.
References:
Xin, Q.C., Zhou, X.W., Wei, N., Yuan, H., An, Z.R., and Dai, Y.J. (2020) A Semiprognostic Phenology Model for Simulating Multidecadal Dynamics of Global Vegetation Leaf Area Index. Journal of Advances in Modeling Earth Systems 12, no. 7, e2019MS001935. https://doi.org/10.1029/2019MS001935.
Figures are courtesy of authors.