Consumers at the heart of energy system?
Consumers at the heart of energy system? This is a complex question and it was the theme of the 12th Conference organised by the British Institute of Energy Economics (BIEE). The DEePRED project is trying to partially answer this question by asking: What is the interaction between the residential consumers and the peak electricity demand? What are the distributional effects of Time-of-Use tariffs?
Residential electricity demand contributes to 35-64% of the peak electricity demand and 29% of annual energy consumption. Because of the short-term nature of the peak demand, it is more expensive to supply and generate electricity during peak time. One of the mechanisms to influence the peak demand is to charge consumers different price every half-hour – reflective of the how stressed the energy system is across all levels.
DEePRED – peak-time activity clusters
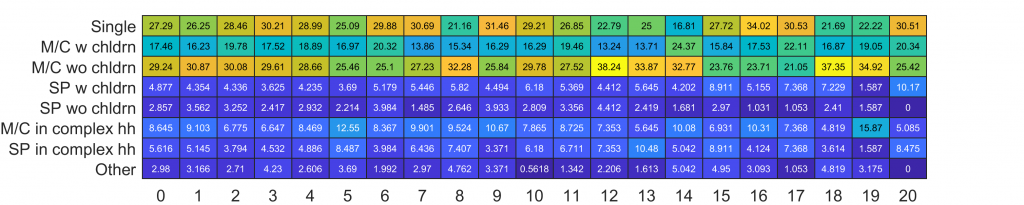
Our research work from the DEePRED project has been selected for the oral session titled “Distributional Aspects of UK Households”. For the session, I have presented our latest findings from the research on the distributional impact of Time-of-Use tariffs. Our analysis of Time Use survey showed that there are clusters of households where residents perform similar number of energy activities at the same periods of the peak time. However, there is no clear dominant socio-demographic parameter that explains the clusters. Animation in Figure 1 shows the socio-demographic information for each cluster along with how many energy-related activities on average are carried by residents in each cluster of households.
DEePRED – synthetic demand profiles
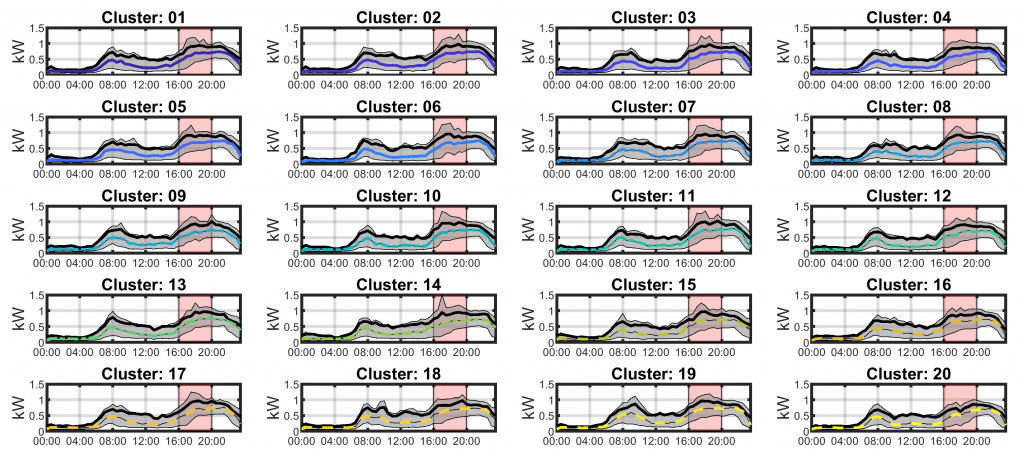
Because we are trying to understand how time-of-use tariffs impact consumers, we need to create electricity demand profiles for the households in these clusters. Using University of Loughborough’s high resolution demand model we have converted the occupancy and activity information for each household in each cluster into electricity demand profiles. The output from the demand model demonstrated that power profiles in each cluster have individual features on top of the standard demand shape. Figure 2 shows the distribution of the household demand profiles in each cluster. Even though the households were clustered by their activities in the evening, we noticed different demand patters in the morning. This finding suggests that activities in households are interconnected and there are sequences of activities that follow the rhythms of the residents.
DEePRED – distributional impact
Using Time-of-Use tariff profiles from the literature, we have compared what impact these Time-of-Use profiles have on the simulated electricity bills of the households in each cluster. The specific design of the tariff will determine the overall impact on the bills, because of the ratio difference between peak and off-peak prices – either all of clusters are worse off or most of the households are better off by at least 3% based on the chosen tariffs. Figure 3 shows the relative mean impact on the bills for each cluster for the chosen tariffs – this can be interpreted as how do clusters compare to each other under different Time-of-Use tariffs.
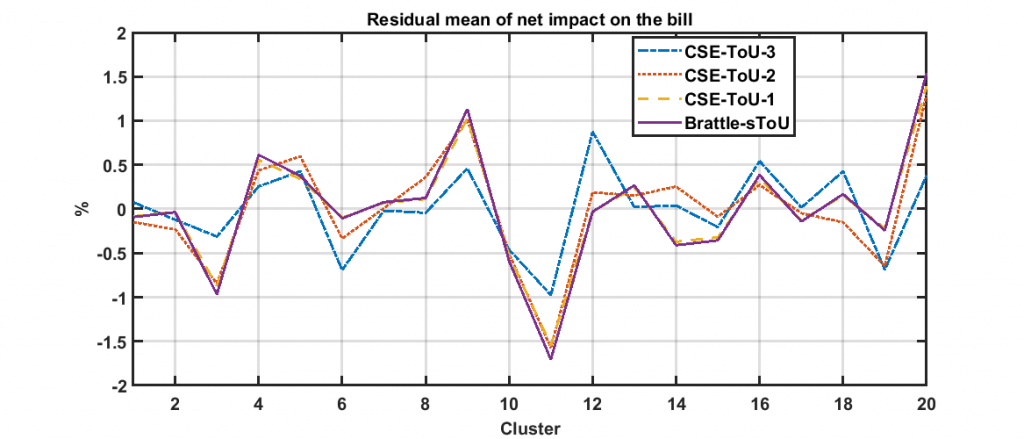
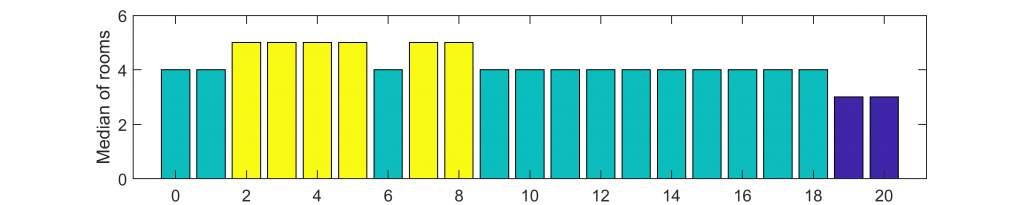
At most, cluster 11 would be better off by on average 1.8% and cluster 20 would be worse off at most by 1.4% compared to other clusters. But why? Apart from the similarity in numbers and timing of energy-related activities at peak time, what socio-demographic parameters could distinguish these two clusters from others?
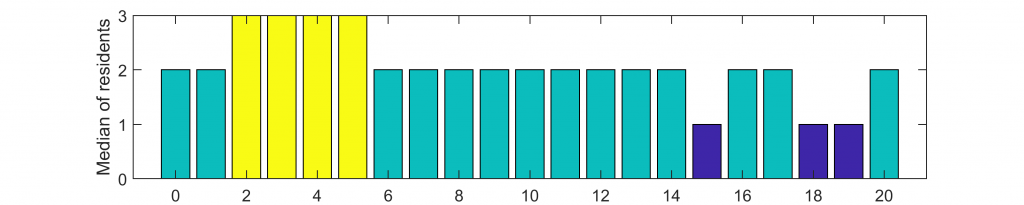
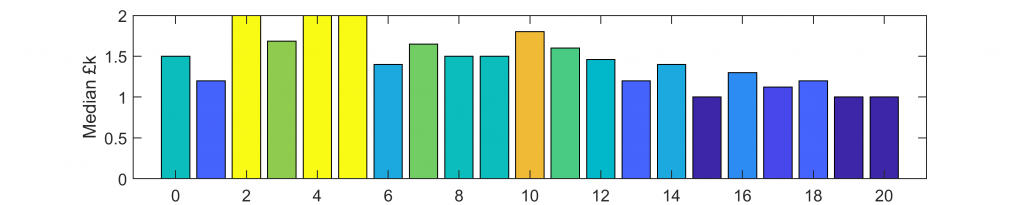
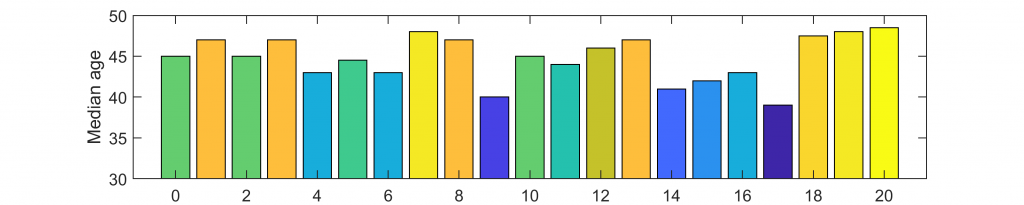
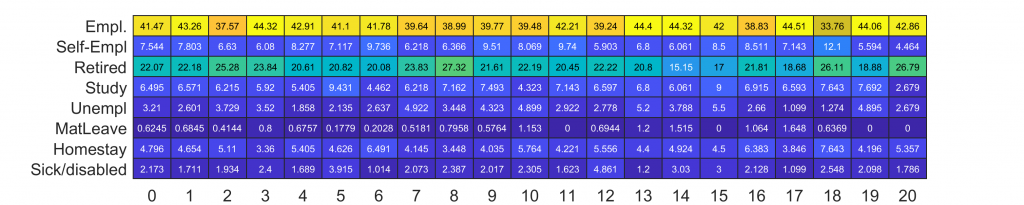
Figures below show the detailed socio-demographic information per cluster. By comparing the mean difference of the impact on the bill with the socio-demographic information we can conclude that here is no single socio-demographic parameter that defines how the household is impacted by the Time-of- Use tariff. This finding suggests that there is synchronisation across the society and household in different socio-demographic groups perform similar activities at similar times.
Further details can be found in the conference proceedings paper: http://centaur.reading.ac.uk/79505/. Also see our other publications.
Next, we will be looking in to the link between combinations of socio-demographic parameter and demand profiles – for example: What is the difference in activities and energy consumption between a single parent with two children living in Greater London and a family of two adults and one child living in the Northern part of England?