Graphs by Timur Yunusov and José Luis Ramírez-Mendiola
The Covid-19 lockdown presented the UK energy system with a new set of challenges, emphasised the importance of renewables and taught some lessons around flexible tariffs and negative prices.

The figure below shows the trend in GB national electricity demand in 2020. The red lines mark the dates of the first death from Covid-19, the 100th death and the beginning of lockdown.
A large proportion of people had to stay at home and this led to an increase in residential electricity demand. This increase has been more than compensated by reductions in industrial and commercial demand. For instance, in the first week of lockdown (i.e. week commenced on 23 March 2020), electricity demand was 13% lower on average compared with the same period a year ago.
The Figure above shows national electricity demand during lockdown (blue line). The shaded red band corresponds to the 95th percentile range, and the average is for years prior to 2020, starting from 2012. The differences have been more market in Southern England and London which according to Elexon experienced demand reductions of over 300MWh on average over individual days.
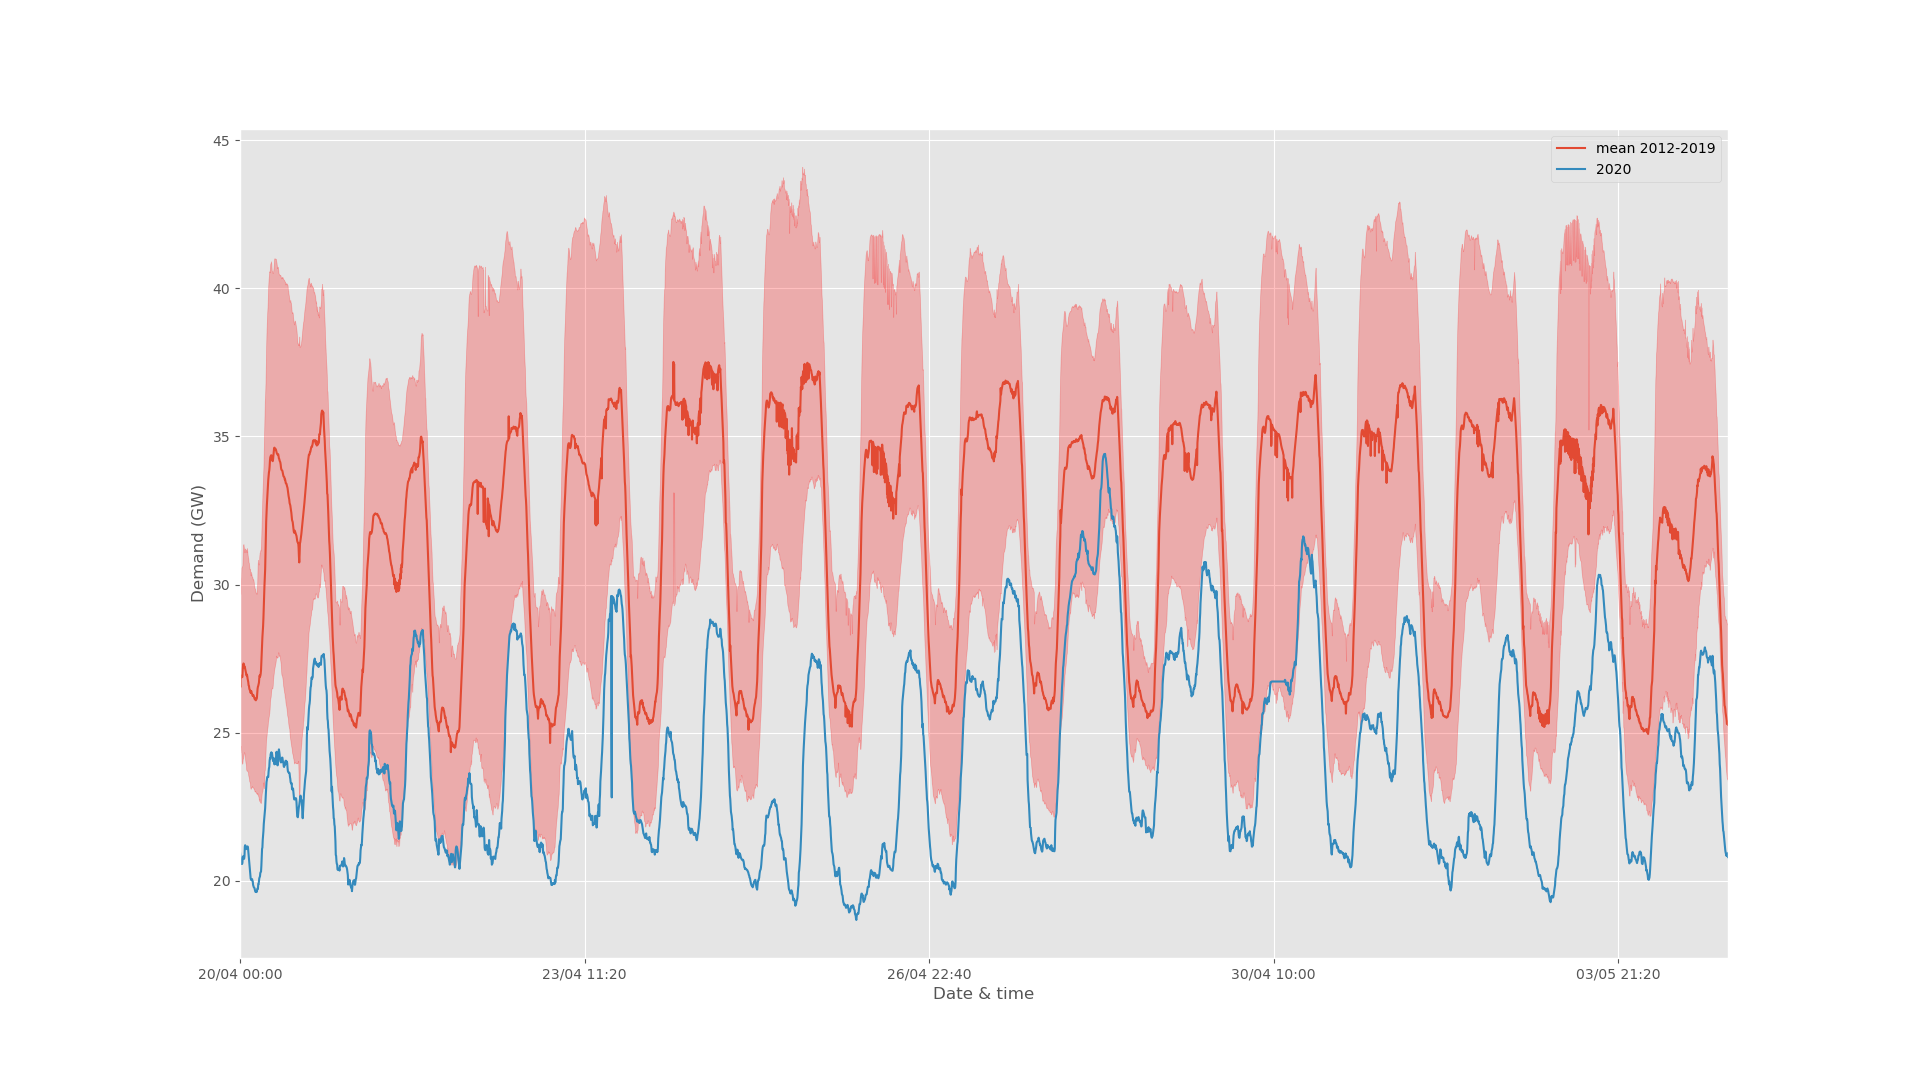
A UKERC blog observed that during the first week of lockdown there was higher homogeneity between weekends and weekdays. Morning peaks during lockdown are lower, whereas evening peaks are still pronounced. Weekday mornings show trends which resemble weekend mornings, with lower peaks. During the day demand remains low and at no point reaches pre-lockdown levels or indeed the average levels from previous years.
The issue of whether weekdays and weekends during lockdown resemble each other call for analysis of demand based on the day of the week. In the figure below we compare Tuesdays, Thursdays and Saturdays for the lockdown weeks with the same period in 2019. What can be observed is that Saturday mornings featured significantly low levels of electricity demand during lockdown. Consumption is reduced on Saturdays and so even more on Sundays. It is therefore on working days that the demand for electricity has fallen most during lockdown.
The timing of people’s activities matters in understanding how electricity demand changes during the day and the week. Not only demand profiles, but also activities changed significantly during lockdown. Data from the Meter project shows that days in lockdown start on average half hour later compared with ‘normal’ days and that activities during the evening are less hectic. British people in lockdown do more gardening, spend more time in front of a screen (arguably because of work from home for adults as well as home learning for children), consumer more hot drinks and do not read more.
During the Covid-19 crisis, renewables were the only type of electricity generation to experience an increase. Windy and sunny days contributed to extremely high levels of generation from renewables. For more than 800 consecutive hours the grid was coal-free for the first time since the industrial revolution. April experienced record levels of solar generation. In May energy demand during Bank Holidays reached even lower levels and solar renewables alone powered one third of national electricity generation. At the end of May solar and wind generation reached 60% of electricity generation.
This combination of low demand because of lockdown and high levels of renewables brought about a relatively new circumstance in the UK: some consumers were remunerated in association with negative system prices. Flexible tariffs, such as ‘Agile’ offered by Octopus Energy are quite rare and limited to consumers with smart meters (for more information, see a new book published by Routledge). Every 30 minutes price is defined on the grounds of demand and whether suppliers are experiencing a surplus or not for a given period. For instance, the great number of sunny and windy days in April have brough about several price plunges. This means that the price of electricity plunges below zero. Information about prices is provided the evening before and this gives the opportunity to consumers to plan when to charge electric vehicles or also traditional appliances like dishwashers and washing machines at times when they will be paid for their consumption. Perhaps even more surprisingly, during the lockdown we started to see examples of flexibility of demand without price. For instance, despite scarcity of flour in supermarkets during the lockdown period, there is a website suggesting best times and days to bake based on the carbon intensity of the grid. Not all flexibility needs to happen through either price or technology. The reconfiguration of demand based on the timing and availability of renewables could lead to higher levels of decarbonisation than we are currently thinking about. And this is something we should reflect on even after lockdown.