But, are these simple numbers helpful for telling the story of all this data and what it means for people living today? Does my simple graphic help? I hope so.
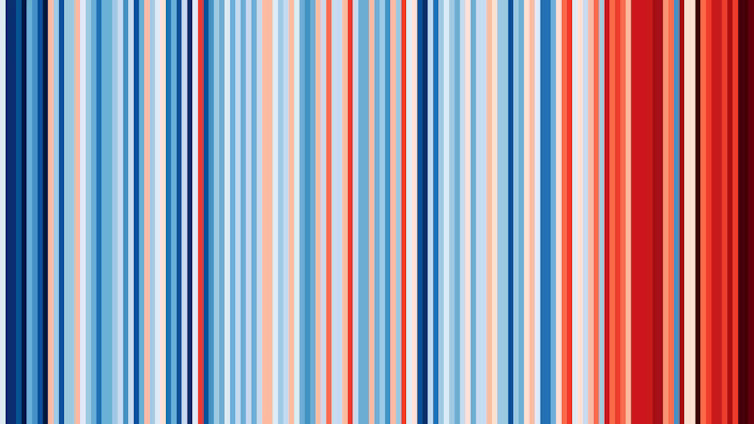
No words, no numbers – just a striking visual which highlights the ongoing warming of our planet. A total of 175 stripes representing each year since 1850, coloured by the global temperature in that year. Blues for colder years, reds for hotter years. It doesn’t need much more explanation for anyone to understand.
These “warming stripes”, adopted around the world as a symbol of climate awareness, action and ambition, have just been updated to include a new dark red stripe for 2024. It was a colour that I had to add for the first time last year when 2023 shattered the previous records.
No one experiences the global average temperature directly. But we can use the same approach to represent how we have lived through our own climate experience, locally. The UK had it’s fourth-warmest year on record. Other countries, such as Germany, had their warmest year on record.
More dark red stripes added, this time to each country’s own warming stripes.

Well done humanity. For it is us who have caused this rapid warming of the planet, and the devastating consequences for people and ecosystems that are so visible today and every day. Many extreme weather events have been made even worse by our reliance on burning fossil fuels, causing misery around the world.
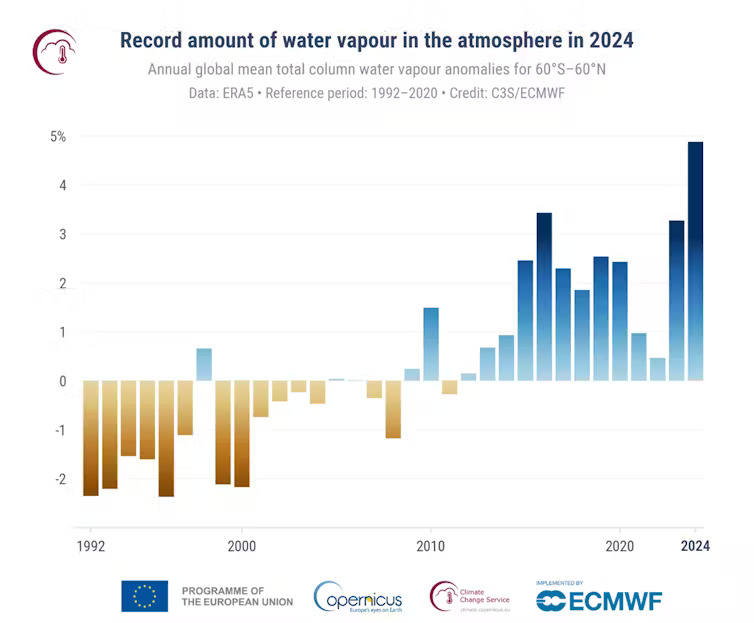
And, it is not only about changes in temperature. The Copernicus Climate Change Service (C3S) has just reported that 2024 was also record-breaking for the amount of water in the atmosphere.
This is important because water vapour is a powerful greenhouse gas, but we cannot directly control how much is in the atmosphere. Warmer sea temperatures encourage more evaporation, and a warmer atmosphere can hold more moisture by around 7% per degree Celsius – amplifying the warming caused by adding carbon dioxide to the atmosphere. The increased levels of water in the atmosphere also mean that heavy rainfall events become more severe.
The consequences, made worse by climate change, in places like eastern Spain and Dubai were very visible during 2024.

Warmer temperatures also lead to drier soils and forests, increasing the risk of fire weather days (days for which the weather conditions are conducive to wildfires) in many places. The ongoing wildfires in Los Angeles, California, are a devastating example of how climate change is influencing how extreme weather is experienced, even in a wealthy country.
Although the consequences of global warming become worse as the planet continues to heat up, it is never too late for the world to take action. The story being told by these warming stripes is not over yet. Because we have caused these problems, we can also solve them. Our choices determine what happens next.

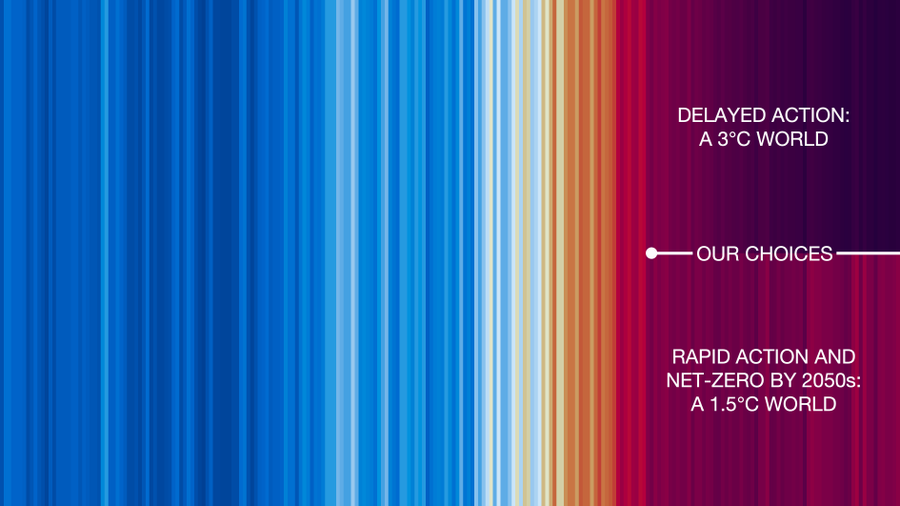
So, what will the future of the warming stripes look like?
Looking back from the future, we might see 2024 as the start of how rapid action to reduce emissions meant a slower period of warming, or even a stabilisation of global temperatures. Or, delayed actions may mean we will eventually see 2024 as a rather cool year, as our children and grandchildren live with much worse climate-related consequences than we are already experiencing now.
Which one of these stories becomes reality depends on our global choices today, and every day until then. We are likely to regret not acting sooner.
Ed Hawkins, Professor of Climate Science, University of Reading
This article is republished from The Conversation under a Creative Commons license. Read the original article.
![]()
