In March’s LEMONTREE science meeting we heard from three Early Career Researchers from our working group E: Ecohydrology on the theme of Evapotranspiration (ET). From theoretical advances in carbon–water coupling, to data-driven model evaluation, to large-scale hydrological partitioning, the talks collectively highlighted both the progress being made by the working group and the complexities we are still grappling with.
Evapotranspiration Estimation within the Carbon–Water Coupled Framework
Helin Zhang (Seoul National University)
Evapotranspiration is often treated as a physically driven flux which is controlled by radiation, temperature, humidity and atmospheric conditions. But the reality is that ET is biologically regulated as plants regulate water loss through stomata, which also control carbon dioxide uptake for photosynthesis. This creates a fundamental coupling between the carbon and water cycles that many models still struggle to fully capture. Therefore, to estimate ET, we must consider photosynthesis, stomatal conductance and leaf energy balance together.
To address this, Helin introduced a carbon–water coupled modelling framework built within the BESS (Breathing Earth System Simulator) model. This framework links canopy photosynthesis, stomatal conductance, and surface energy balance to estimate ET in a more integrated way. A key innovation in his work is the use of carbonyl sulfide (OCS) as an additional observational constraint. OCS is an atmospheric trace gas widely used as a proxy for gross photosynthesis, because it enters leaves through a pathway similar to CO₂ but is irreversibly hydrolyzed inside the leaf. This makes it a cleaner proxy for photosynthetic activity without the confounding effects of respiration.
By incorporating OCS into the model, primarily through its influence on stomatal conductance, Helin demonstrated improved agreement between simulated and observed ET, particularly during the growing season, even at sub-daily timescales. Importantly, he also moved away from static parameter assumptions by introducing a dynamic optimisation approach, as the carbon and water fluxes are not fixed but rather regulated by soil moisture, VPD, CO2 effects, vegetation structure and land-atmosphere feedback. Using a sliding time window, key parameters such as the slope of the stomatal conductance model are allowed to vary over time, better reflecting the dynamic nature of environmental conditions.
Beyond model performance, Helin explored the broader relationship between gross primary productivity (GPP) and ET for global FLUXNET observations. Contrary to expectations of a tight coupling, observations revealed a relatively weak relationship, especially in semi-humid and humid regions. This decoupling was most pronounced in transitional zones between water-limited and energy-limited regimes, where environmental controls on carbon uptake and water loss diverge. Many models, however, overestimate the strength of this coupling, failing to reproduce these patterns.
His key message was clear: carbon–water coupling is dynamic, not fixed. Improving ET estimation requires models that can adapt to shifting environmental constraints and novel tracers like OCS may play an important role in getting us there.
Evaluating P-model transpiration at sub-daily scale using sap flow data.
Akash Verma (Imperial College London)
Akash’s talk focused on a different but equally important question: how well do our models actually reproduce real-world plant water use, particularly at fine temporal scales?
Transpiration is a critical link between land and atmosphere, and essential for understanding plant responses to extreme conditions like droughts and heatwaves. However, evaluating it remains difficult due to limited observations. This work leverages the SAPFLUXNET dataset, a global collection of sap flow measurements that provide direct insight into plant-level water transport.
Using these data introduces a key challenge: scaling from individual trees to ecosystem-level transpiration. Akash addressed this through a multi-step upscaling approach. Sap flow measurements, recorded at intervals of 10 to 30 minutes, were aggregated to hourly values, normalised by tree basal area, and averaged across species. Only time periods with sufficient observational coverage were retained, resulting in a robust dataset spanning 42 forest sites mainly in Europe and North America.
These observations were then compared to transpiration simulated by the P-model at sub-daily resolution. The modelling framework incorporated meteorological inputs, aerodynamic conductance, and soil moisture constraints, while also accounting for a 15-day “memory effect” in plant responses.
Two methods were used to estimate transpiration: a formulation based on Fick’s law, and the Penman–Monteith equation. Both approaches captured aspects of observed variability, but consistent biases emerged. Overall, the model tended to overestimate transpiration magnitude.
Looking more closely at diurnal cycles revealed important differences between the methods. The Fick’s law approach showed a clear timing mismatch, with peak transpiration occurring two to three hours later than observed, and unrealistic nighttime fluxes. In contrast, the Penman–Monteith approach reproduced the shape of the daily cycle much more accurately, although it still overestimated absolute values.
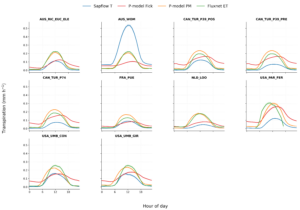
To provide additional context, Akash compared these results with ecosystem-scale evapotranspiration from FLUXNET. Interestingly, Penman–Monteith-based transpiration estimates aligned more closely with total ET, while sap flow-based estimates were consistently lower. Overall, the overestimation of transpiration raises important questions about where discrepancies originate—whether from the upscaling process, or the model assumptions.
Akash concluded that while the P-model shows promise for capturing sub-daily dynamics, however it consistently overestimates transpiration magnitude. Fick’s law shows a shift in peak transpiration by about 2-3 hours, in contrast, the Penman-Monteith approach captures the timing more accurately (albeit with some overestimation in magnitude still). Resolving this magnitude biases remains a key challenge.
Insight into ET Partitioning and the PET variation
Amin Hassan (University of Pittsburgh)
Closing the session, Amin turned attention to large-scale hydrological patterns, focusing on how evapotranspiration is partitioned, and how uncertainties in potential evapotranspiration (PET) propagate through our analyses.
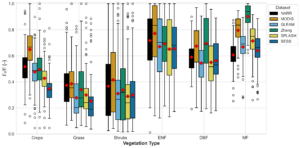
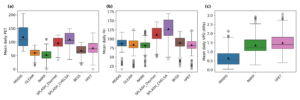
A central metric in his work is the ratio of transpiration to total evapotranspiration (T/ET), which varies across ecosystems depending on vegetation structure and climate. Using multiple datasets across 648 of US watersheds, Amin showed clear patterns: grasslands and shrublands exhibit the lowest T/ET ratios, likely due to higher soil evaporation and partial vegetation cover, while forests show the highest ratios, reflecting denser canopies and reduced soil evaporation. However, the estimates of t/et vary depending on the method used (models, isotopes, remote sensing of site measurements).
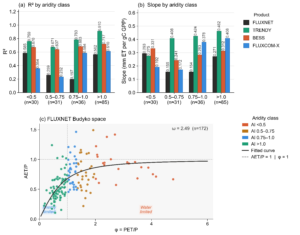
To improve consistency across datasets, Amin introduced a PET rescaling approach with two stages of partitioning. By preserving the modelled ET/PET ratio and applying it to observed ET from long-term hydrological observations. He derived adjusted PET values that reduce discrepancies between datasets. This step proved important, as raw PET estimates varied substantially depending on the product used.
The analysis also explored how T/ET relates to environmental drivers. As expected, transpiration fraction increased with leaf area index and soil moisture, and decreased with aridity and temperature, while showing only weak dependence on wind speed. Extending this, Amin examined the ratio of transpiration to precipitation (T/P) and its relationship with aridity. Consistent with previous studies, he found a peak T/P ratio of around 0.5–0.6 at intermediate aridity levels of around 2, reflecting an optimal balance between water availability and atmospheric demand.
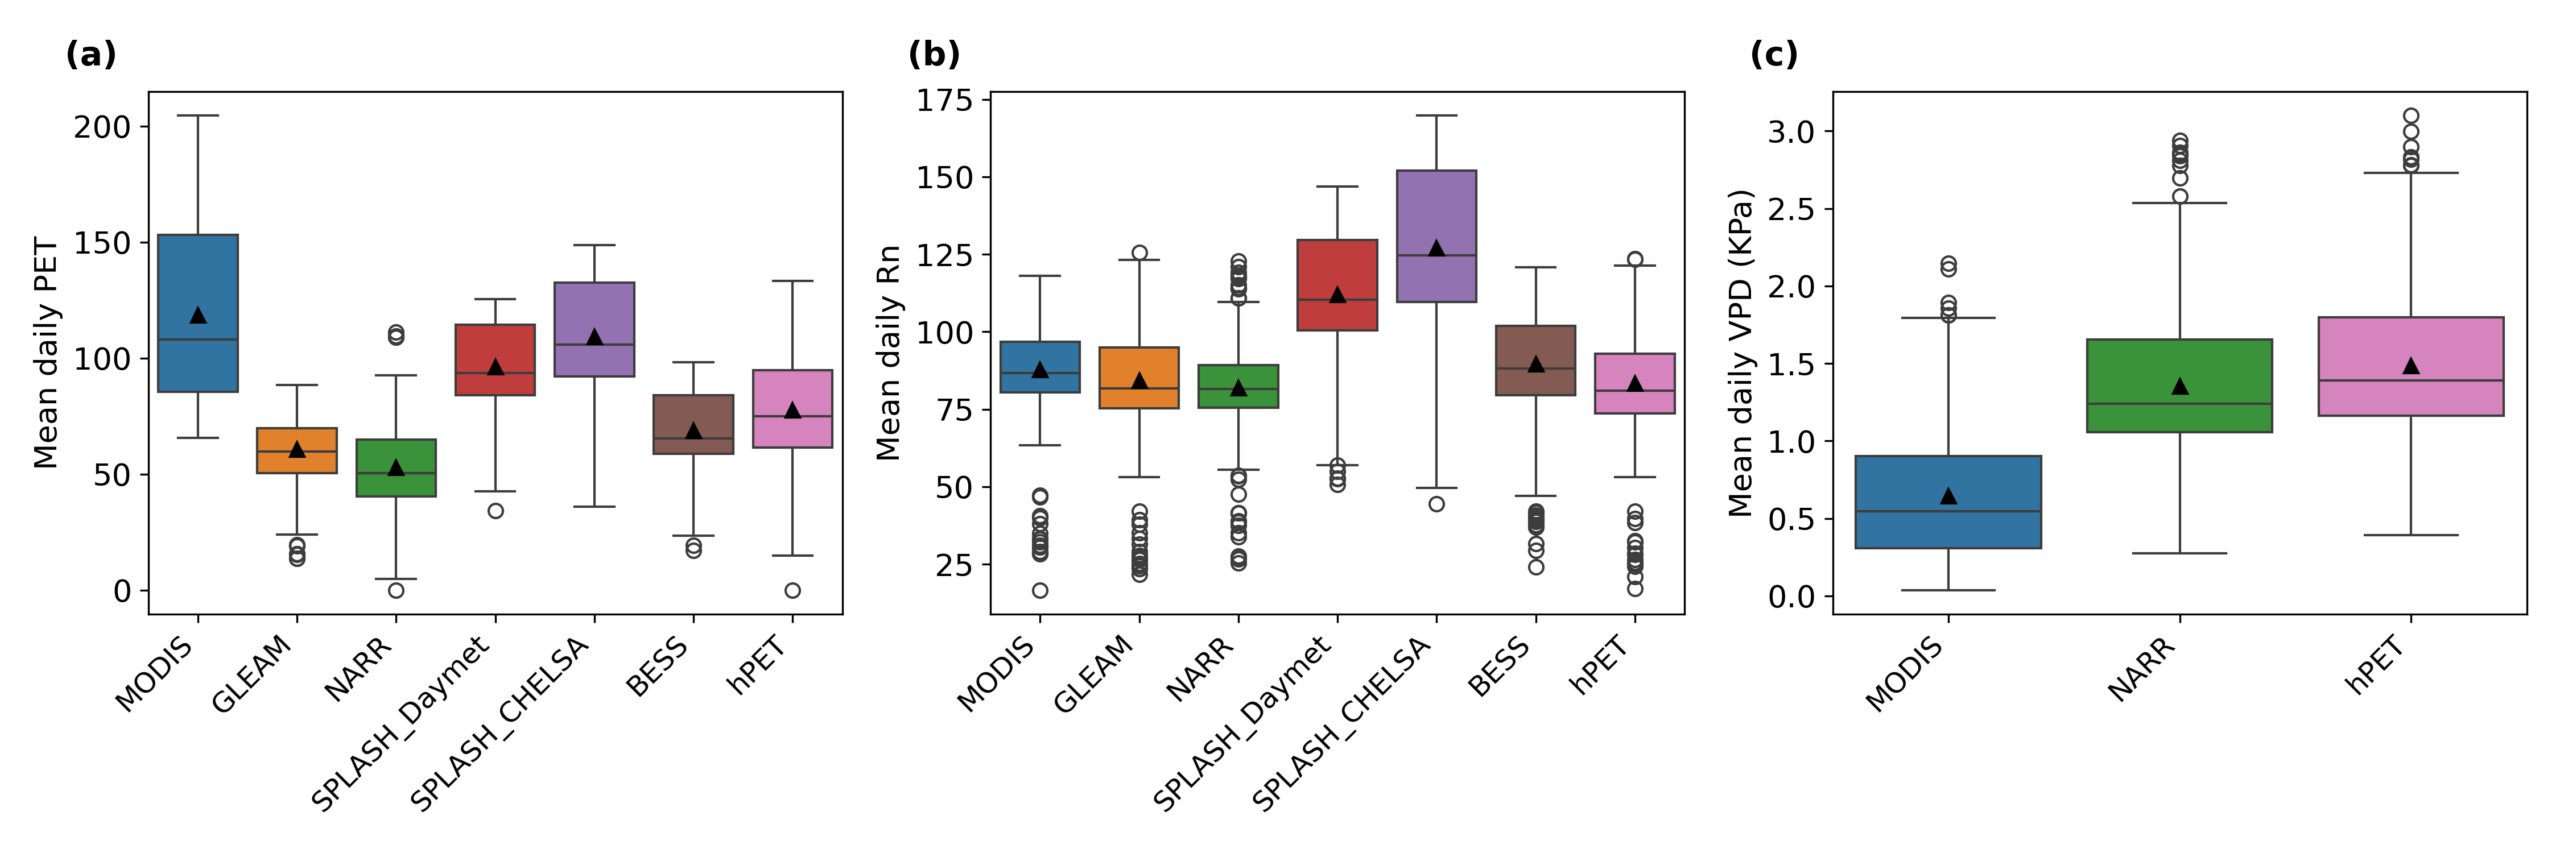
So why do the PET estimates differ so wildly between datasets? Amin identified three main sources:
- differences in input data (particularly net radiation and vapour pressure deficit),
- parameter values,
- the PET equation itself.
These discrepancies were especially pronounced in arid regions and during summer months, where forcing data uncertainties are amplified.
Finally, he explored ways to improve PET estimation within the Priestley–Taylor framework by allowing the key parameter (α) to vary with climate conditions, rather than assuming a constant value. By linking α to a climate resistance metric, Amin demonstrated improved performance compared to the traditional fixed value approach.
If this work interests you, please take a look at our other blogs on this topic: