It has been 8 months since we last had an update on the phenology work being carried out by members of the LEMONTREE team (click here for a recap of our last talks). We were meant to have our phenology update in December, but for one reason or another, the timings changed. Apt. So instead, phenology was the focus of our February science meetings. Here is a summary of the presentations by Cai Wenjia, Boya Zhou, and Ziqi Zhou.
Cai Wenjia: A unifying principle for global greenness patterns and trends
The exchanges of carbon, water and energy between terrestrial ecosystems and the atmosphere are regulated by vegetation cover, often quantified by leaf area index (LAI). Leaf area is thus a key determinant in characterising plant biophysical and biochemical processes. It is one of the most significant forcings on the GPP trend on the global scale and therefore important for modelling the impacts of climate change. However, global leaf area are not well constrained, as different models and satellite products do not agree on the magnitude and/or the trend of LAI. The leaf area is controlled by the available energy (temperature, length of growing season and light) and available water (precipitation).
We developed an LAI framework where our hypothesis is that the seasonal maximum fAPAR is either limited by the available carbon allocated to leaves (energy-limited fAPAR) or limited by the amount of water available for plant uptake (water-limited fAPAR). The inputs for the simulations included: short-wave radiation, precipitation, soil moisture, CO2 concentration, elevation, temperature, and water vapour pressure.
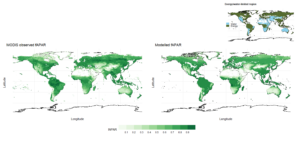
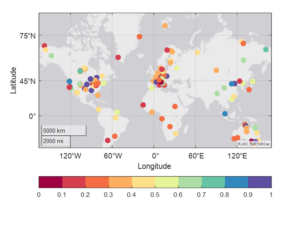
At the site level, our comparison of predicted fAPARmax compared to observations was strong with R2=0.7. The main bias came from the shrublands habitat type. At the global level, we compared the spatial distribution of simulated (using the P model) and observed (MODIS) global seasonal maximum fAPAR. We also calculated the temporal trends, and we could see general global greening trends but also some browning trends, mostly in central Asia and the Caatinga region in Brazil.
We showed that the overall driver of seasonal fAPAR max is controlled by CO2. But there are differences at the regional level with temperature dominant at high latitudes and precipitation dominant in arid and semi-arid regions (i.e., in the water-limited regions).
Boya Zhou: Towards a global phenology model using Phenocam data
Xin et al (2020) developed a semi-prognostic phenology model which could be used to construct a time series of Leaf Area Index (LAI) at the global scale. This model assumes both a simple linear relationship with GPP and that a steady state of LAI will be reached with a changing climate. There are two main limitations to this model. Firstly, the GPP model is too simple, but we can now use the more sophisticated P model. Secondly, the semi-prognostic phenology model required the use of LAI max values from satellite data. However, we can now use the maximum fAPAR model as described by Cai Wenjia (Cai et al., 2023) which is independent of satellite data.
By using the max fAPAR model and the P model, we now developed a new global phenology model based on a linear relationship between gross primary production (GPP) and the Leaf Area Index (LAI) under unchanging environments. It allows the dynamics of LAI to be derived from the time course of gross primary production (GPP) using the Lambert function because LAI and GPP are mutually related, via the Beer’s law dependence of GPP on LAI, and the requirement for GPP to support LAI development. We modelled the actual time course of LAI with the assumption that its derivative tracks the difference between current and steady-state LAI with some lag.
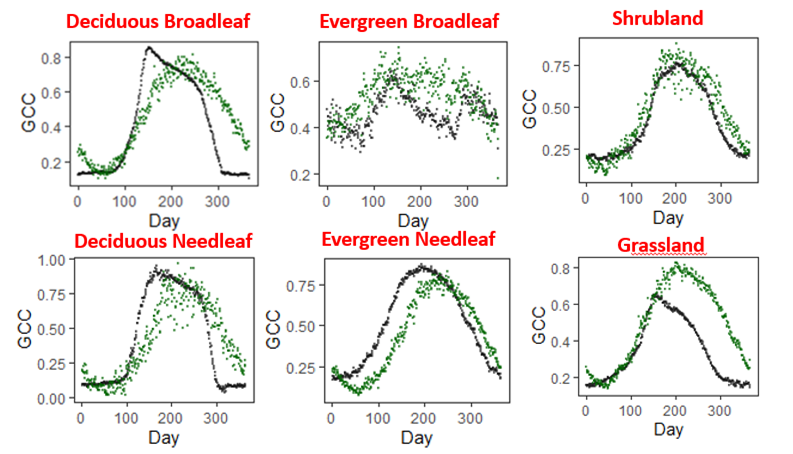
We evaluated this new model with daily Green Chromatic Coordinate (GCC) data gathered from the Phenocam website (North America), TERN, Brazil, and Africa and environmental WFDE5 data between 2000-2019. Our new phenology model captures the annual variation pattern of GCC (observed) and the LAI (modelled). However, the predicted LAI peak is later than the GCC and GCC decreases faster than the predicted LAI in autumn, perhaps due to leaf colour changes that occur before leaf fall. Our model shows consistency among locations and captures the overall trends in observed annual mean GCC. This new framework for global phenological modelling is independent of satellite data and has successfully simulated the seasonal time course of LAI in all biomes. Our next steps are to limit the maximum predicted LAI values and simulate the dynamics of m.

Ziqi Zhu: Phenology model for simulating dynamics of leaf area index
Plant phenology, the recurring sequence of plant developmental stages, is important for plant functions and ecosystem services and is sensitive to the ongoing climate change. Robust models that simulate both leaf dynamics and canopy photosynthesis are needed to understand vegetation–climate interactions. However, current terrestrial biosphere models need better representation of vegetation phenology. The potential reason for simulating the pool performance of leaf dynamics is that it is still largely empirical so far. Here, following the study of Xin et al, we developed a simple time-stepping scheme to simulate leaf area index (LAI) and phenology when forced with climate variables. In this method, a linear function between steady-state LAI and corresponding GPP is established. The developed time-stepping scheme provides a simplified version of modelling approach to simulate leaf phenology which can be applied globally. This model can capture the spatial variation of global vegetation leaf area index, but it has some limitations in characterizing interannual variation and trend.
The time-stepping method uses the parameter m to account for the effect of allocation in response to environmental changes. The issue is to find the appropriate values of m for different biomes. One way to determine the values of m is to find the regression slope between leaf area index and gross primary production on a monthly basis. However, model parameterization requires extensive testing.
References:
Xin, Q. et al. (2020) A Semiprognostic Phenology Model for Simulating Multidecadal Dynamics of Global Vegetation Leaf Area Index, Journal of Advances in Modeling Earth Systems, 12(7), p. e2019MS001935. Available at: https://doi.org/10.1029/2019MS001935.
Cai, W. et al. (2023) A Unifying Principle for Global Greenness Patterns and Trends, Nat. Clim. Chang. (In preparation).