During volcanic eruptions Volcanic Ash Advisory Centers (VAAC) produce forecasts of ash location and concentration. However, these forecasts are deterministic and do not take into account the inherent uncertainty in the forecasts due to incomplete knowledge of the volcano’s eruption characteristics and imperfect representation of atmospheric processes in numerical models. This means flight operators have incomplete information regarding the risk of flying following an eruption. There is a need for a new generation of volcanic ash hazard charts allowing end users to make fast and robust decisions using risk estimates based on state-of-the-art probabilistic forecast methods.
Case Study: Raikoke 2019
Here, a method for visualizing ash concentration forecasts using a risk-matrix approach will be applied to the 2019 eruption of Raikoke 2019. These risk-matrix graphics reduce the ensemble information into an easy-to-use decision-making tool. In this work the risk level is determined by combining the concentration and dosage of volcanic ash and the likelihood of that concentration occurring. Here the visualisation technique is applied to both an a priori 1000 member ensemble with perturbed eruption source parameters and internal simulator parameters and a posterior ensemble, also with a 1000 members, with parameters perturbed using ranges refined by matching the a prior ensemble to HIMAWARI satellite retrievals of ash column loading. The overall area of risk is reduced by over 60% when using the posterior ensemble at a lead time of 48 hours. This demonstrates the impact of using satellite observations to constrain the forecast uncertainty and their potential to reduce the disruption to airline operations. This approach could be extended to include other aviation hazards, such as desert dust, aircraft icing and clear air turbulence.
Application to Raikoke case study
Below are some static outputs of risk for the 2019 Raikoke eruption. To look at more times please visit http://www.met.reading.ac.uk/~py904867/home/research4.php
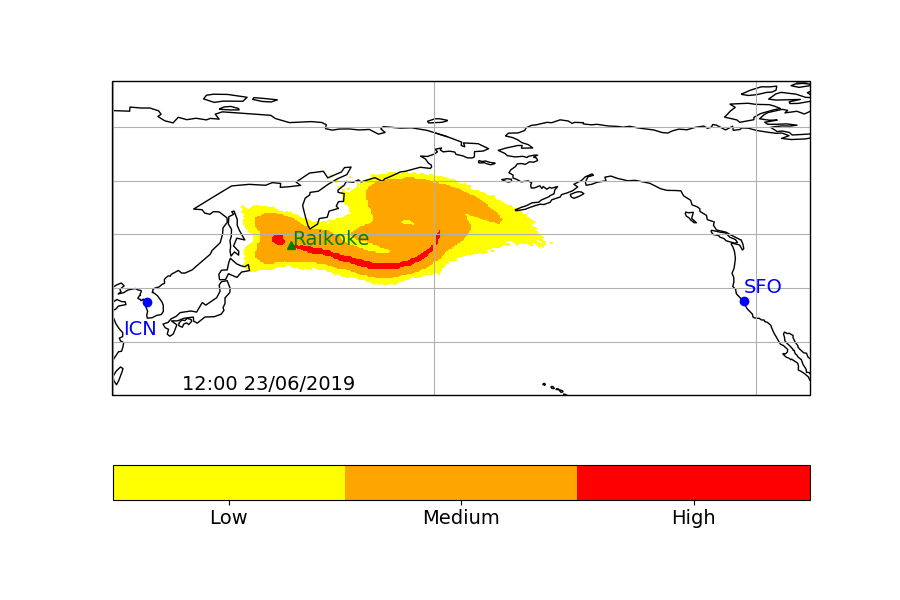
Risk map for 1200UTC on 23 June 2019
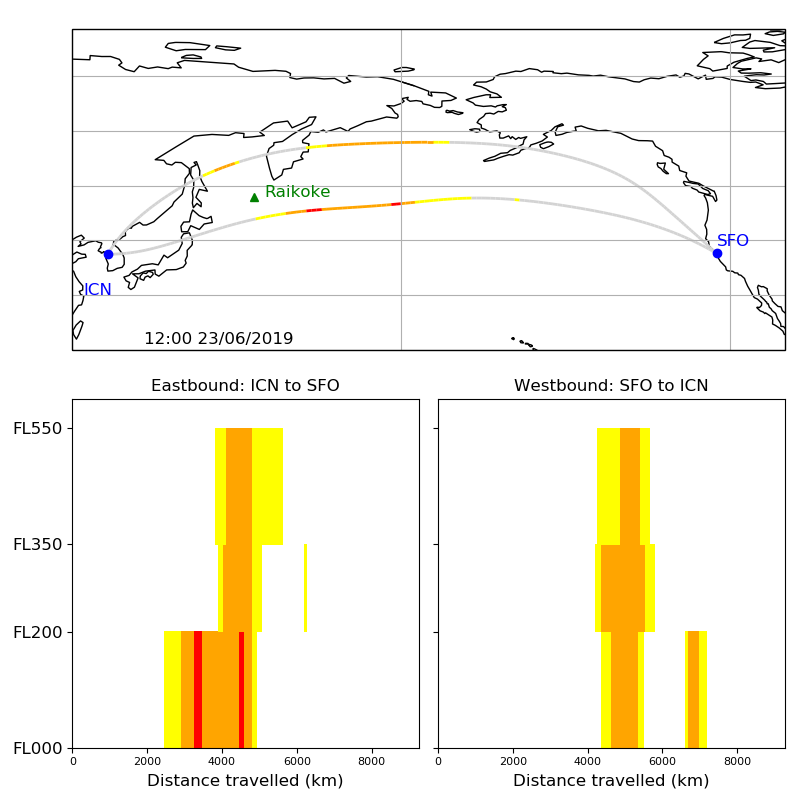
Risk projected on to a flight trajectory and associated vertical cross section for 1200UTC on 23 June 2019
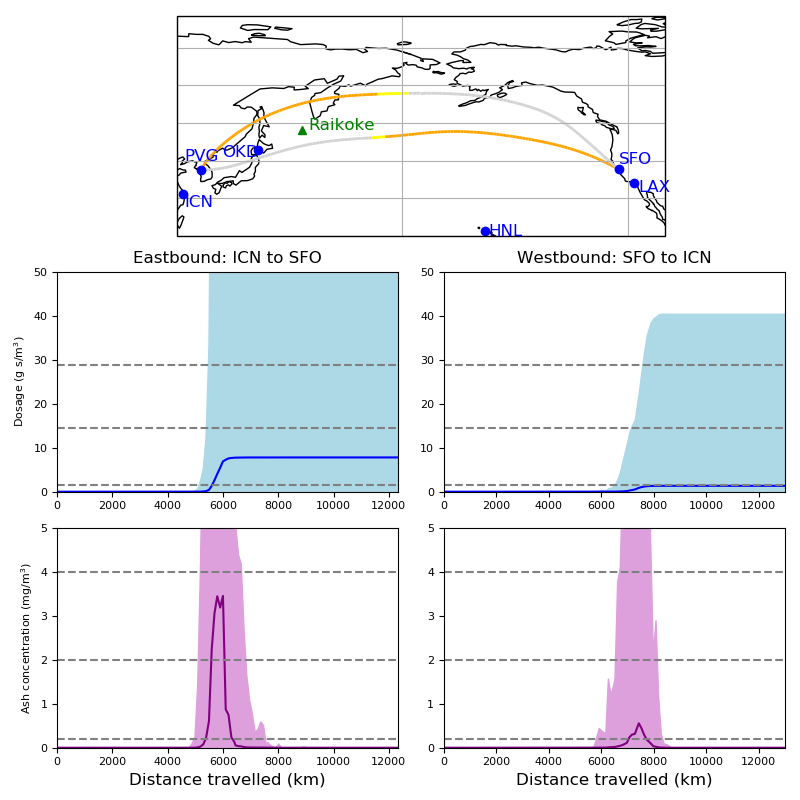
Dosage risk along a flight trajectory on 23 June 2019