Wetropolis flood demonstrator
By Onno Bokhove, School of Mathematics, University of Leeds, Leeds.
- What is Wetropolis?
The Wetropolis flood demonstrator is a conceptual, life installation showcasing what an extreme rainfall event is and how such an event can lead to extreme flooding of a city, see below in Fig. 1. A Wetropolis day is chosen to be 10s and it rains on average every 5.5min for 90% of the time during a Wetropolis day, i.e., 9s in two locations both in an upstream reservoir and in a porous moor in the middle of the catchment. This is extreme rainfall and it causes extreme flooding in the city. It can rain either 10%, 20%, 40% or 90% in a day; and, either nowhere, only in the reservoir, only on the porous moor or in both locations. Rainfall amount and rainfall location are randomly drawn via two skew-symmetric Galton boards, each with four outcomes, see Fig. 2. Each Wetropolis day, so every 10s, a steel ball falls down the Galton board and determines the outcome, which outcome we can follow visually: at the first split there is a 50% chance of the ball going to the left and of 50% to the right, and the next two splits one route can only go right with a 100% chance and the other one splits even with 50%-50% again; subsequent splits are even again. An extreme event occurs with probability 7/256, so about 3% of the time. In 100 wd’s, or 1000s, this amounts to about every 5.5min on average. When a steel ball rolls through one of the four channels of the Galton board it optically triggers a switch and via Arduino electronics each Galton board steers pump actions of (1,2,4,9)s causing it to rain in the reservoir and/or the porous moor.
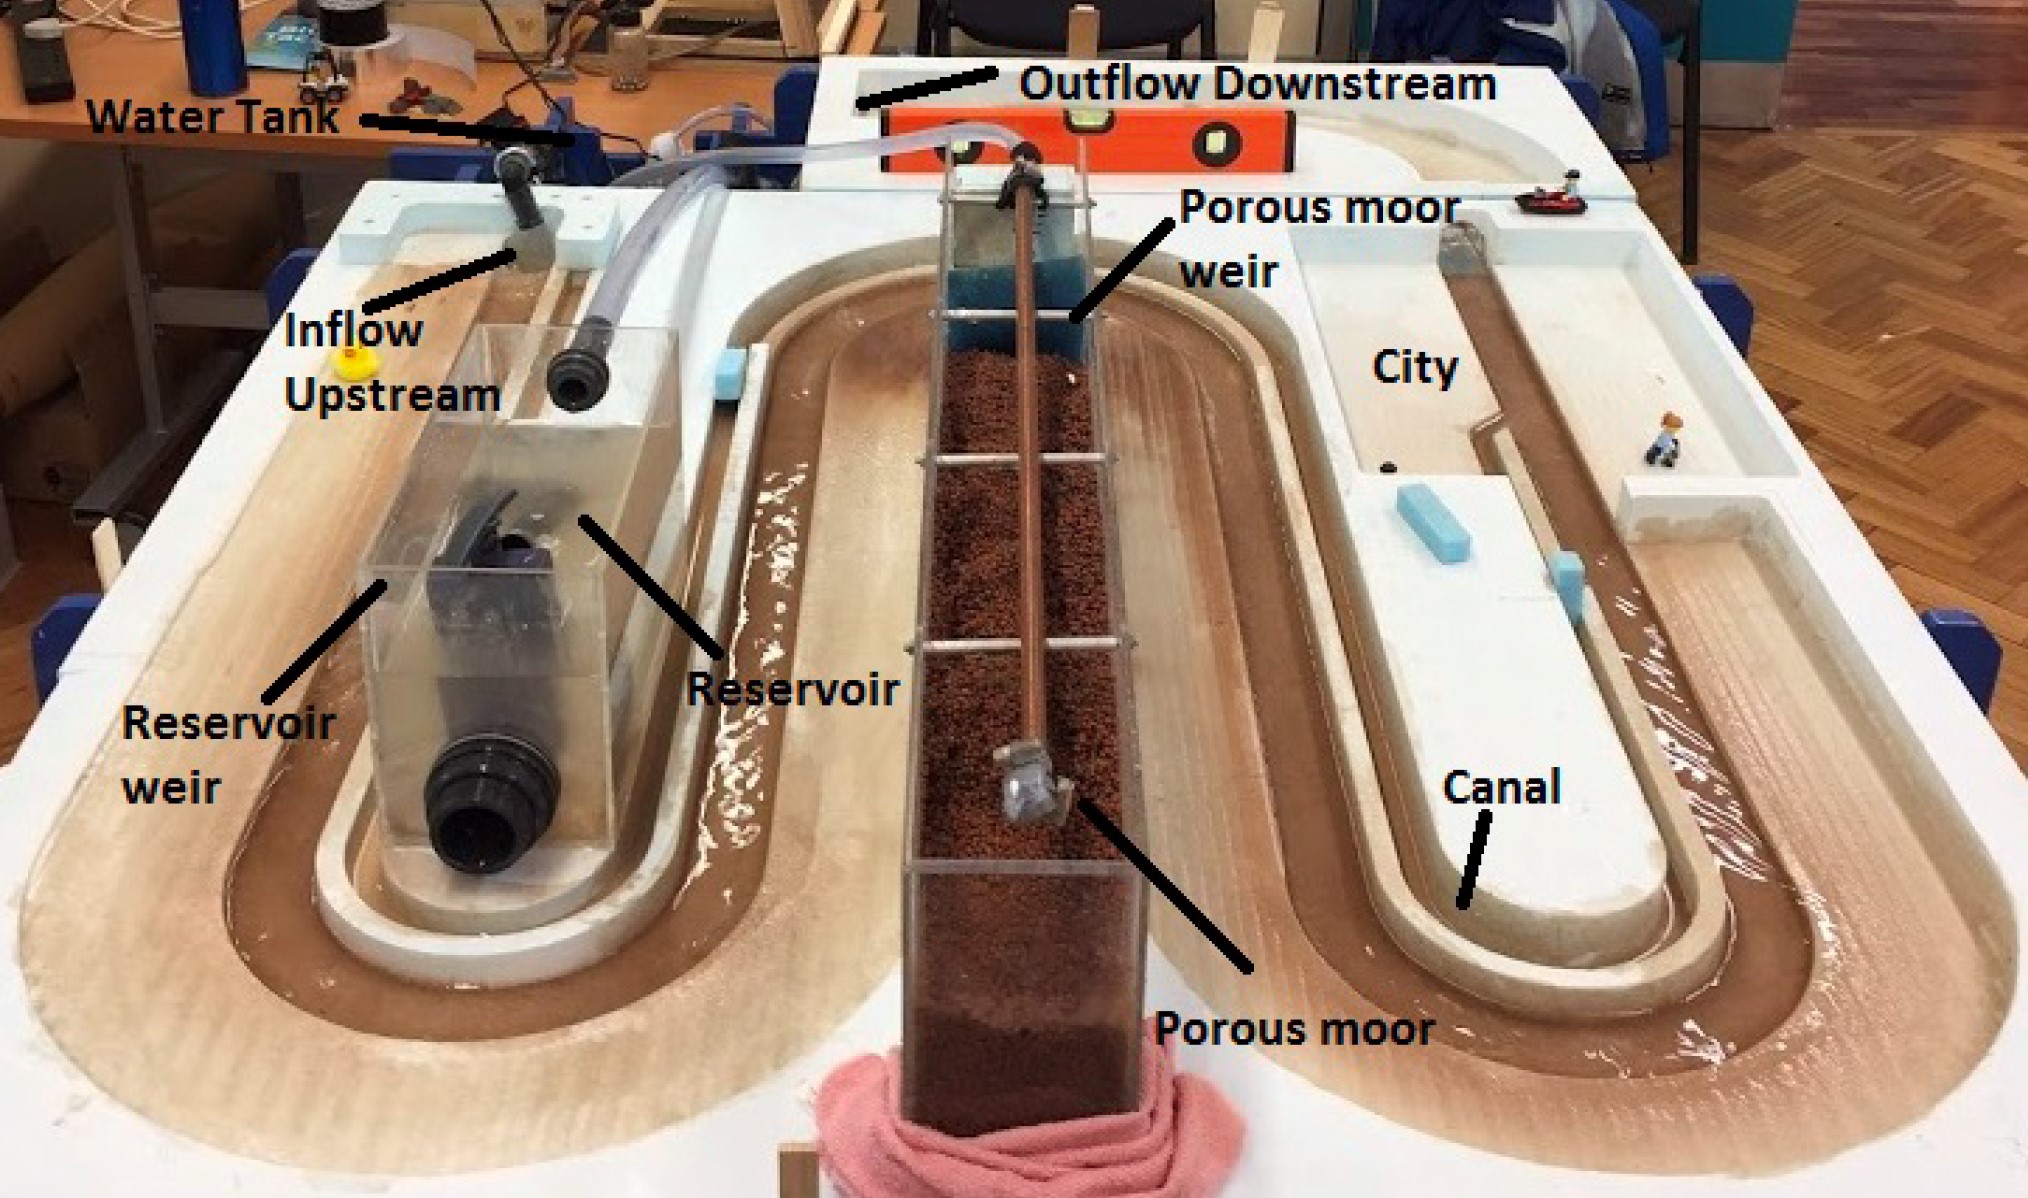
Fig. 1. Overview of the Wetropolis flood demonstrator with its winding river channel of circa 5.2m and the slanted flood plains on one side, a reservoir, the porous moor, the (constant) upstream inflow of water, the canal with weirs, the higher city plain, and the outflow in the water tank/bucket with its three pumps. Two of these pumps switch on randomly for (1,2,4,9)s of the 10s `Wetropolis Day’ (SI-unit: wd). Photo compilation: Luke Barber.
Wetropolis’ construction is based on my mathematical design with a simplified one-dimensional kinematic model representing the winding river, a one-dimensional nonlinear advection diffusion equation for the rainfall dynamics in the porous moor, and simple time-dependent box models for the canal sections and the reservoir, all coupled together with weir relations. The resulting numerical calculations were approximate but led to the design by providing estimates of the strength of the pumps (1-2l in total for the three aquarium pumps), the length and hence the size of the design with the river water residence time typically being 15-20s, and the size of the porous moor. The moor visually shows the dynamics of the ground water level during no or weak rainfall as well as strong rainfall, and how it can delay the through flow when the conditions are dry prior to the rainfall by circa 2-3wd (20-30s). When the rainfall is strong, e.g., for two consecutive days of extreme Boxing Day rainfall (see movie in [2]), the moor displays surface water overflow and thus drains nearly instantly in the river channel.

Fig. 2 Asymmetric Galton board. Every Wetropolis day, 10s, a steel ball is released at the top (mechanism not shown here). The 4×4 possible outcomes in two of such boards, registered in each by 4 electronic eyes (not shown here either), determine the rainfall and location in Wetropolis, repectively. Photo: Wout Zweers.
Wetropolis’ development and design was funded as an outreach project in the Maths Foresees’ EPSRC Living with Environmental Change network [1].
- What are its purposes?
Wetropolis was first designed to be a flood demonstrator in outreach purposes for the general public. It can fit in the back half of a car and can be transported. Comments from everyone, including the public, are positive. Remarks from scientists and flood practitioners such as people from the Environment Agency, however, made us realise that Wetropolis can also be used and extended to test models and explore concepts in the science of flooding.
- Where has Wetropolis been showcased hitherto?
The mathematical design and modelling was done and presented early June 2016 at a seminar for the Imperial College/University of Reading Mathematics of Planet Earth Doctoral Training Centre. Designer Wout Zweers and I started Wetropolis’ construction a week later. One attempt failed (see June 2016 posts in [2]) because I made an error in using the Manning coefficient in the calculations, necessitating an increase of the channel length to 5m to have sufficient residence time of water in the 1:100 sloped river channel. Over the summer progress was made with a strong finish late August 2016 so we could showcase it at the Maths Foresees’ General Assembly in Edinburgh [1]. It was subsequently shown at the Leeds Armley Museum public Boxing Day exhibit December 8th, 2016 and also in March 2017. I gave a presentation for 140 flood victims for the Churchtown Flood Action Group Workshop, late January 2017 in Churchtown, on the science of flood including Wetropolis. We showcased it further at: Be Curious public science festival, University of Leeds; the Studygroup Maths Foresees (see Fig. 3), at the Turing Gateway to Mathematics, Cambridge; and, a workshop of the River and Canal Trust in Liverpool.
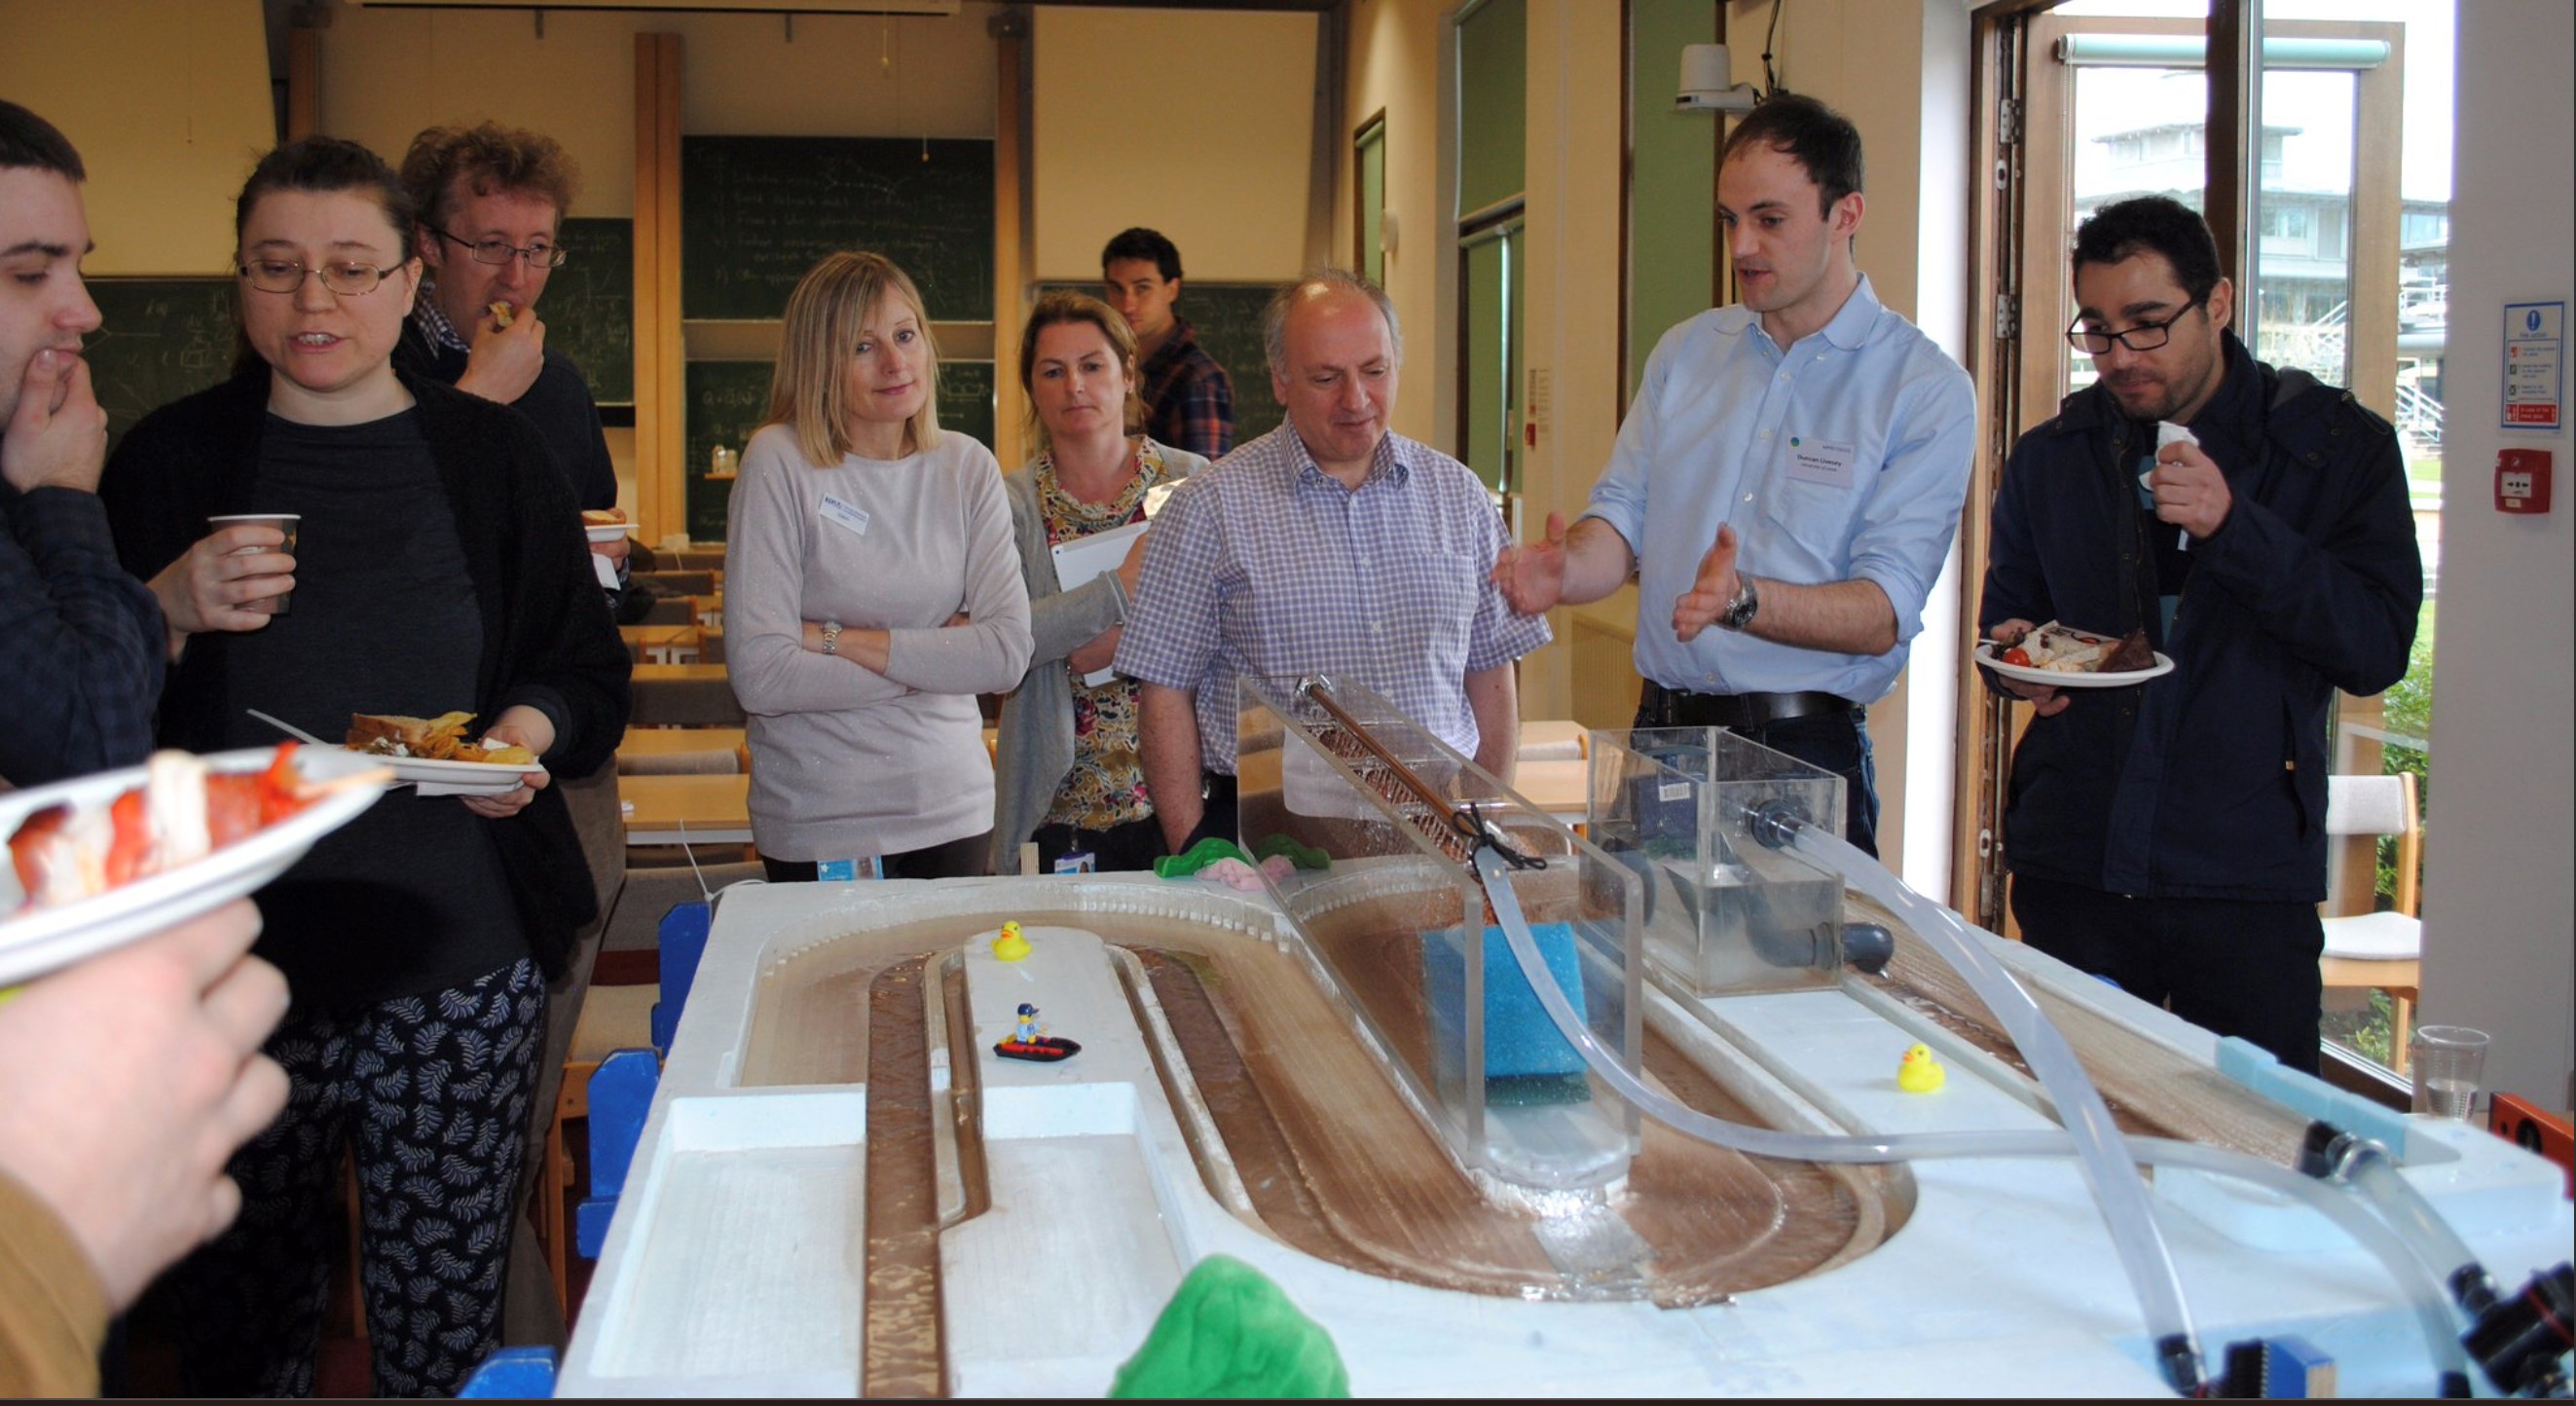
Fig. 3. Wetropolis at the Turing Gateway to Mathematics. Photo TGM. Duncan Livesey and Robert Long (Fluid Dynamics’ CDT, Leeds) are explaining matters.
- What are its strengths and weaknesses?
The strength of Wetropolis is that it is a life visualisation of probability for rainfall and flooding in extreme events combined, river hydraulics, groundwater flow, and flow control, since the reservoir has valves such that we can store and release water interactively). It is a conceptual model of flooding rather than a literal scale model. This is both a weakness and a strength because one needs to explain the translation of a 1:200 return period extreme flooding and rainfall event to one with a 1:5.5min return period, explain that the moor and reservoir are conceptual valleys where all the rain falls, since rain cannot fall everywhere. This scaling and translation is part of the conceptualisation, which the audience, whether public or scientific, needs to grasp. The visualisations of flooding in the city and the ground water level changes will be improved.
- Where does Wetropolis go from here?
Wetropolis’ revisited is under design to illustrate aspects of Natural Flood Management such as slowing-the-flow by inserting or taking our roughness features, leaky dams and the great number of such dams needed to create significant storage volume of flood waters, as well as the risk of their failure. Wetropolis will (likely) be shown alongside my presentation in the DARE international workshop on high impact weather and flood prediction in Reading, November 20-22, 2017. Finally, analysis of river levels gauges combined with the peak discharge of the Boxing Day 2015 floods of the Aire River leading to the extreme massive flooding in Kirkstall, Leeds reveals that the estimated flood excess volume is about a 1 mile by 1 mile by 1.8m deep (see [3] and Fig. 4). Storing of all this excess flood volume in 4 to 5 artificially induced and actively controlled flood plains upstream of Leeds seems possible. Moreover, it could possibly have prevented the floods. Active control of flood plains via moveable weirs is now considered, also in a research project with Wetropolis featuring as conceptual yet real test environment. (PhD and/or DARE postdoc posts are available soon.)
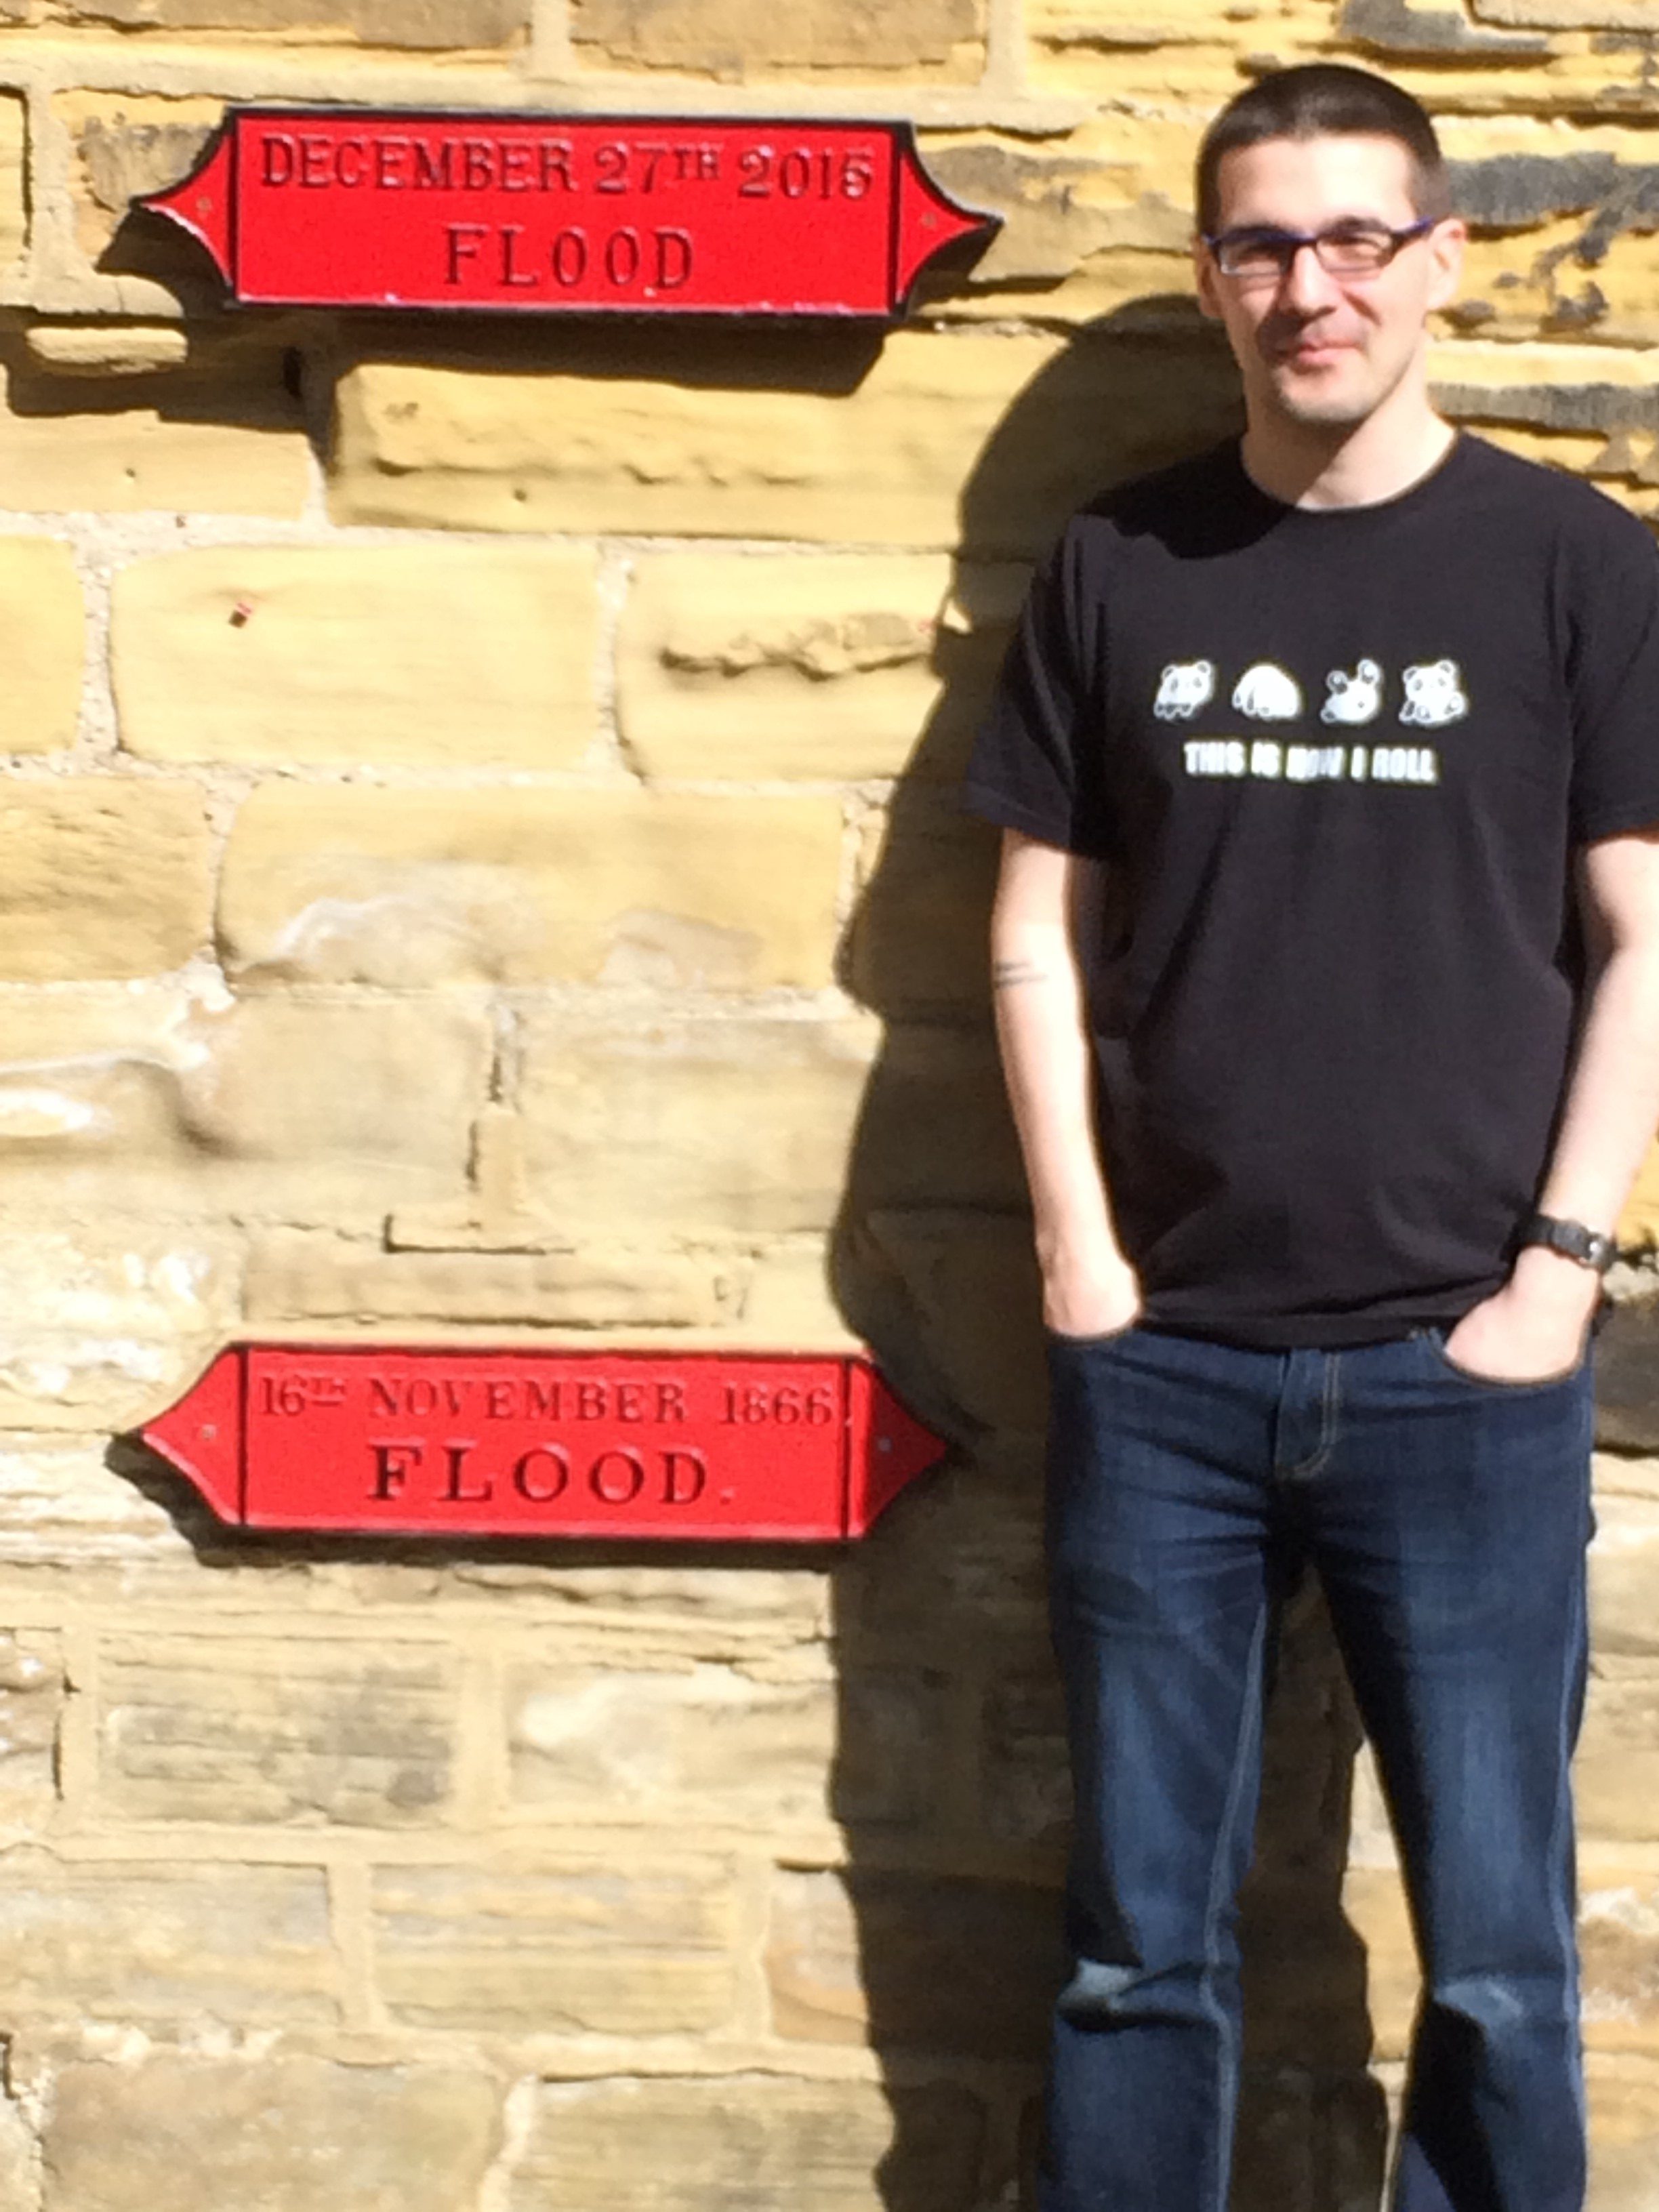
Fig. 4. Leeds’ flood levels at Armley Mills Museum: 1866: bottom, 2015: top, 5.21m. Photo O.B. with Craig Duguid (Fluid Dynamics’ CDT, Leeds) showcasing Wetropolis.
References and links
[1] Maths Forsees UK EPSRC LWEC network [2] Resurging Flows, public page with movies of experiments, river flows and Boxing Day 2015 floods in Leeds and Bradford, photos and comments on fluid dynamics. Two movies on 31-08-2016 show Wetropolis in action. In one case two consecutive extreme rainfall events led to a Boxing Day 2105 type of flood. (What is the chance of this happening in Wetropolis?) Recall that record rainfall over 48hrs in Bingley and Bradford, Yorkshire, contributed for a large part to the Boxing Day floods in 2015. [3] ‘Inconvenient Truths’ about flooding . My introduction at the 2017 Study Group.