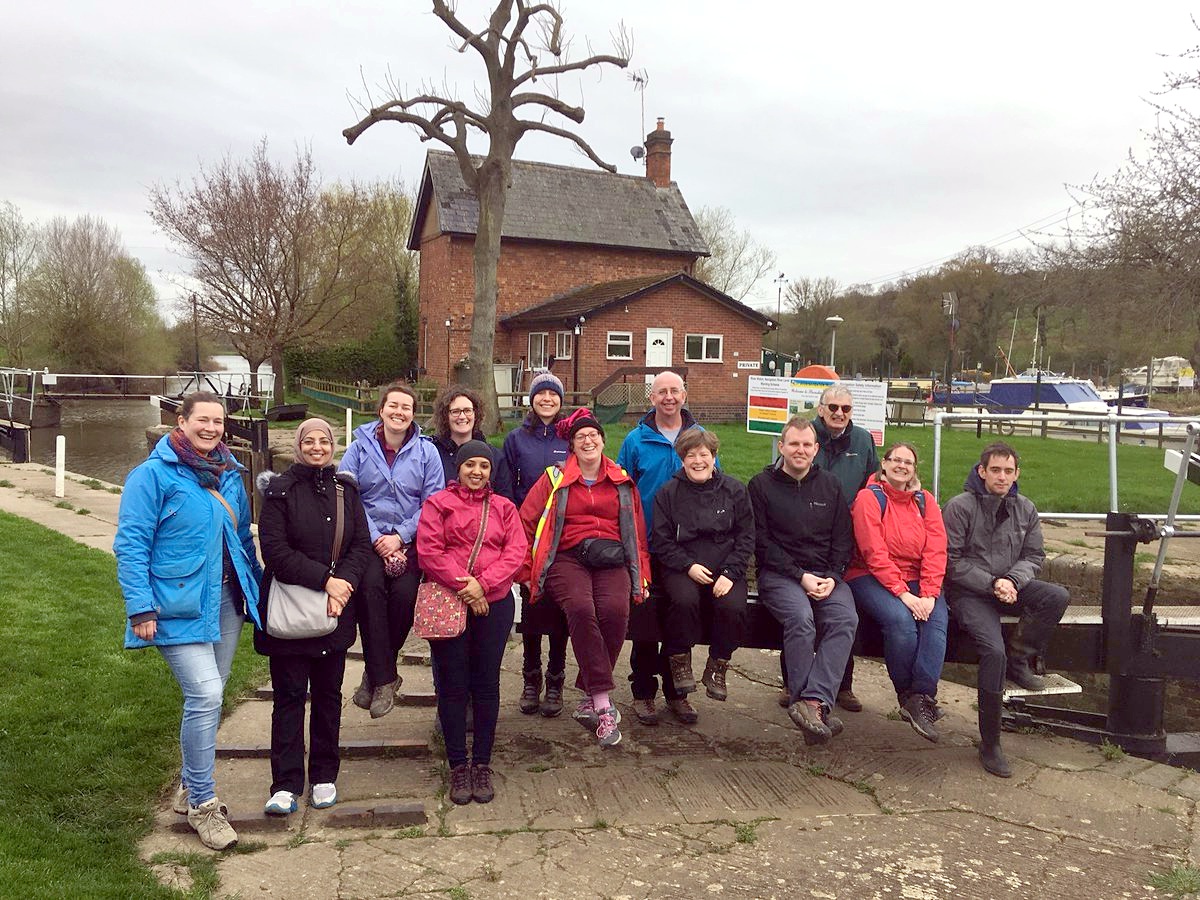
The Dare team went on a field trip last month! It was a well planned and executed trip – as you would expect from a group of mathematicians. It was also a very interesting trip for us since most of us have only ever used data (e.g. for improving forecasts) not collected it. Even better Tewkesbury area has become a sort of benchmark for testing new data assimilation methods, ideas, tools, observations, etc, and so many of us have worked with LisFlood numerical model (developed by a team led by Prof. Paul Bates at the University of Bristol) over the Tewkesbury domain. We have seen the river runs in the model outputs, watched the rivers Avon and Severn go out of banks in our plots, and investigated various SAR images of the area but we have never been to the area. We generally do not need to visit the area when working with the models, however, now that there was a chance to do so, it was no surprise that many of us were keen to go. And we did go like ‘d’ A-team:
However we had a more important reason for visiting too – we were going to the Tewkesbury area to collect metadata from a number of river cameras located near Tewkesbury town. These river cameras are high definition webcams owned and serviced by Farson Digital Ltd in various location over the UK. We had recently discovered that six of such cameras are within the LisFlood model domain and have captured the November 2012 floods in the area. With the permission from the Farson Digital Ltd, we have obtained hourly daylight images of the floods from 21st November 2012 to 5th of December 2012. Hence, the aim our trip was to obtain accurate (with errors of no more than few centimeters) positional information (i.e. latitude, longitude, height) of the cameras themselves as well as the positional information of a number of markers in the images for each of the cameras. We need this information to extract as accurately as possible water extents and water depth from these images using image processing tools (which we are currently working on).
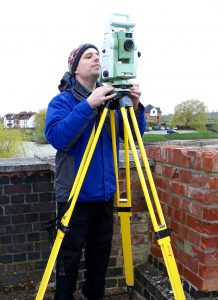
To take these measurements we had borrowed some tools from the Department of Geography at the University of Reading. We used a differential GPS tool (GNSS) to very accurately (on order of few centimeters) measured the position of a given point in 3D space, that is its latitude, longitude, and height above the sea level, however, it had to be used on the ground (e.g. could not measure remote or high points such as building corners where some cameras were mounted) and not be too close to buildings or large trees. To measure remote and high points we used Total Station, which allowed us to shoot a laser beam to the desired point to measure its 3D position in space.
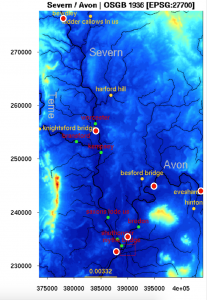
We had planned to visit all six cameras within the space of the two days 16th and17th of April, however, despite our best plans and fantastic organisation skills we were too ambitious with our time and we had to drop the camera furthest from our base – the Bewdley camera (see map with camera positions in figure 2). Thus, on our first day, we took measurements from Wyre Piddle, Evesham, and Digglis Lock cameras, spotting ourselves live on the Farson Digital Ltd site.
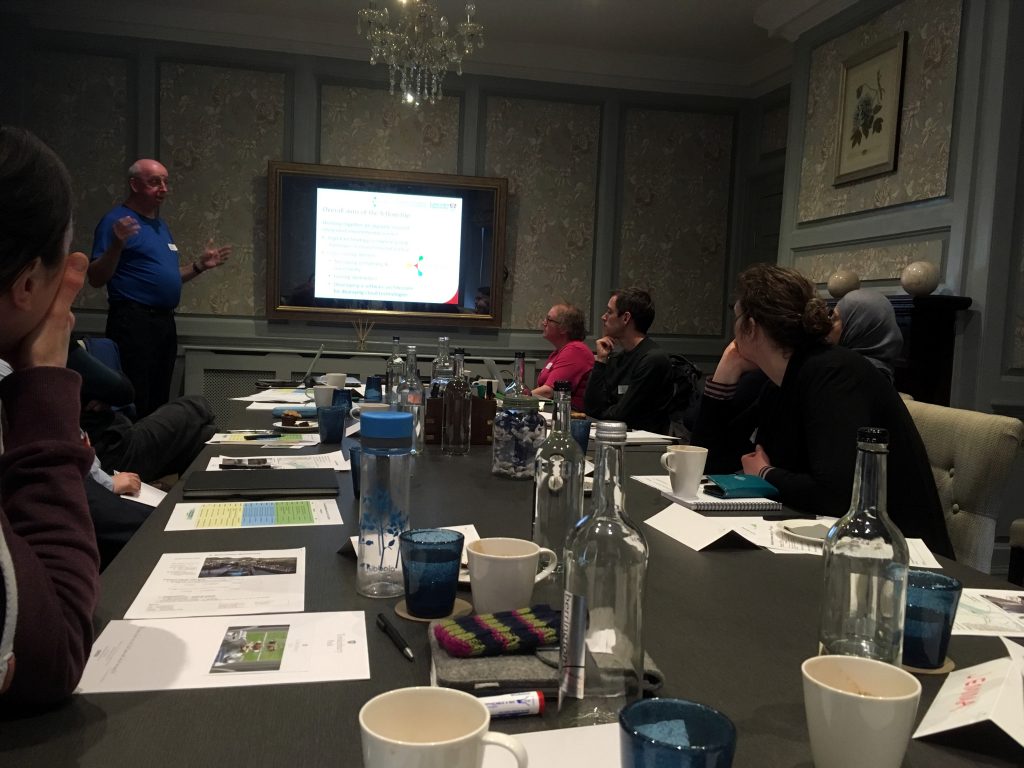
We returned to our base – the Tewkesbury Park Hotel, to be joined by the Ensemble team from the Lancaster University. Ensemble Project is lead by Prof. Gordon Blair, and as Dare is funded by the EPSRC Senior Fellowship in Digital Technology for Living with Environmental Change. It was very interesting to meet the Ensemble project team and learn more in-depth about their work, future interests, and scope for the collaboration.
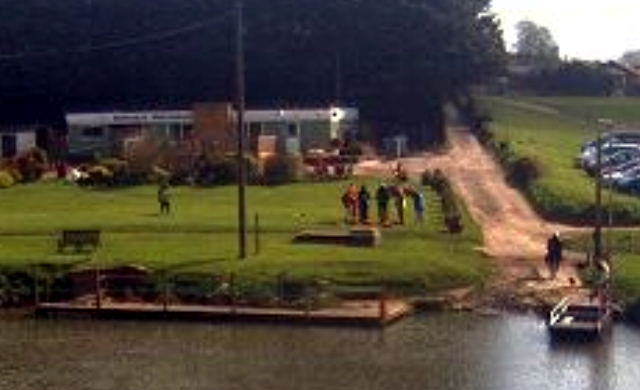
On our second day, the Dare team visited the Tewkesbury camera while the Ensemble team learned more about the purpouse of the data collection and the Novermber 2012 floods in the area. Then we all jointly measured a large number of points at the Strensham Lock. In 2012 we all would have been totally sumberged in water in this picture since the flood waters completely swallowed the island on which the house is standing flooding the building along with it.

Our grand finale was the meeting with the director of the Farson Digital Ltd Glyn Howells as well as a number of stakeholders who have commissioned the cameras we visited. It was very interesting for us to learn how the network of the river cameras was born from the need to know and understand the current state of the river for a variety of river users – fishermen, campers, boaters, etc. Also, how these cameras have become invaluable assets to many stakeholders for various reasons – greatly reducing the number of river condition related phone enquiries, monitoring river bank and bridge conditions, and so on.
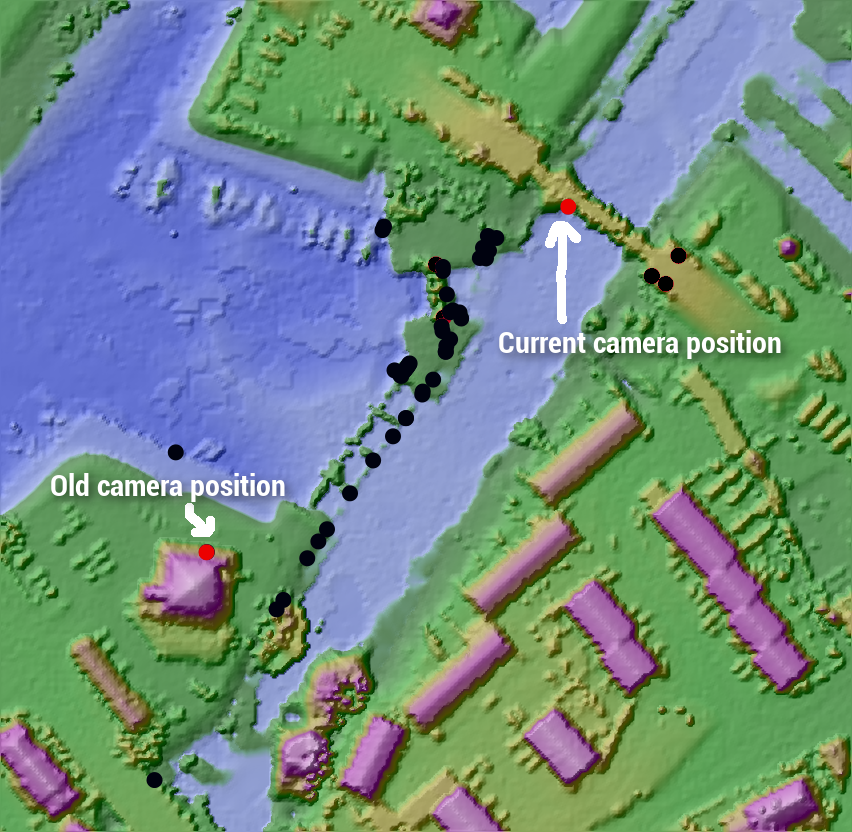
Now a month later we have downloaded and processed the data we collected from these stations. In figure 7 we have plotted the data points we took at the Tewkesbury site, owned both by the Environmental Agency and Tewkesbury Marina (both of which we greatly thank for their support and assistance before and during our trip, especially to Steve Edgar from EA and Simon Amos and Bruno from Tewkesbury Marina). In the figure, the red dots are the camera positions – pre-2016 and current camera positions, and the black dots are all the other measurements we took using both the TotalStation and GNSS tools, which are plotted against the Environmental Agency lidar data with 1m horizontal resolution.
We are currently working on extracting the water extent from these images which we then will use to produce water depth observations. Our final aim is to see how much forecast improvement such rich source of observations offer, in particular, before the rising limb of the flood.
We are very thankful to Glyn Howells and the various stakeholders for permitting us to use of the images, allowing us to take the necessary measurements, assisting us on the sites, and joining at the workshop!