Jemima M. Tabeart is an PhD student at the University of Reading in the Mathematics of Planet Earth Centre for Doctoral Training, she has received funding from the DARE training fund to attend Data Assimilation tutorials at the Workshop on Sensitivity Analysis and Data Assimilation in Meteorology and Oceanography, 1-6 July 2018, Aveiro, Portugal. Here she writes about her research work.
In order to produce the best weather forecast possible, we want to make use of all available sources of information. This means combining observations of the world around us at the current time with a computer model that can fill in the gaps where we have no observations, by using known laws of physics to evolve observations from the past. This combination process is called data assimilation, and our two data sources (the model and observations) are weighted by our confidence in how accurate they are. This means that knowledge about errors in our observations is really important for getting good weather forecasts. This is especially true where we expect errors between different observations to be related, or correlated.
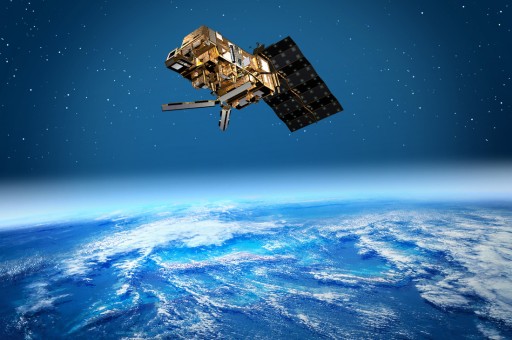
Caption: An image of the satellite MetOp-B which hosts IASI (Infrared Atmospheric Sounding Interferometer) – an instrument that I have been using as an example to test new mathematical techniques to allow correlated errors to be used inexpensively in the Met Office system. Credit: ESA AOES Medialab MetOp-B image.
Why do such errors occur? No observation will be perfect: there might be biases (e.g. a thermometer that measures everything 0.5℃ too hot), we might not be measuring variables that are used in a numerical model, and converting observations introduces an error (this is the case with satellite observations), and we might be using high density observations that can detect phenomena that our model cannot (e.g. intense localised rainstorms might not show up if our model can only represent objects larger than 5km). Including additional observation error correlations means we can use observation data more intelligently and even extract extra information, leading to improvements in forecasts.
However, these observation error correlations cannot be calculated directly – we instead have to estimate them. Including these estimates in our computations is very expensive, so we need to find ways of including this useful error information in a way that is cheap enough to produce new forecasts every 6 hours! I research mathematical techniques to adapt error information estimates for use in real-world systems.
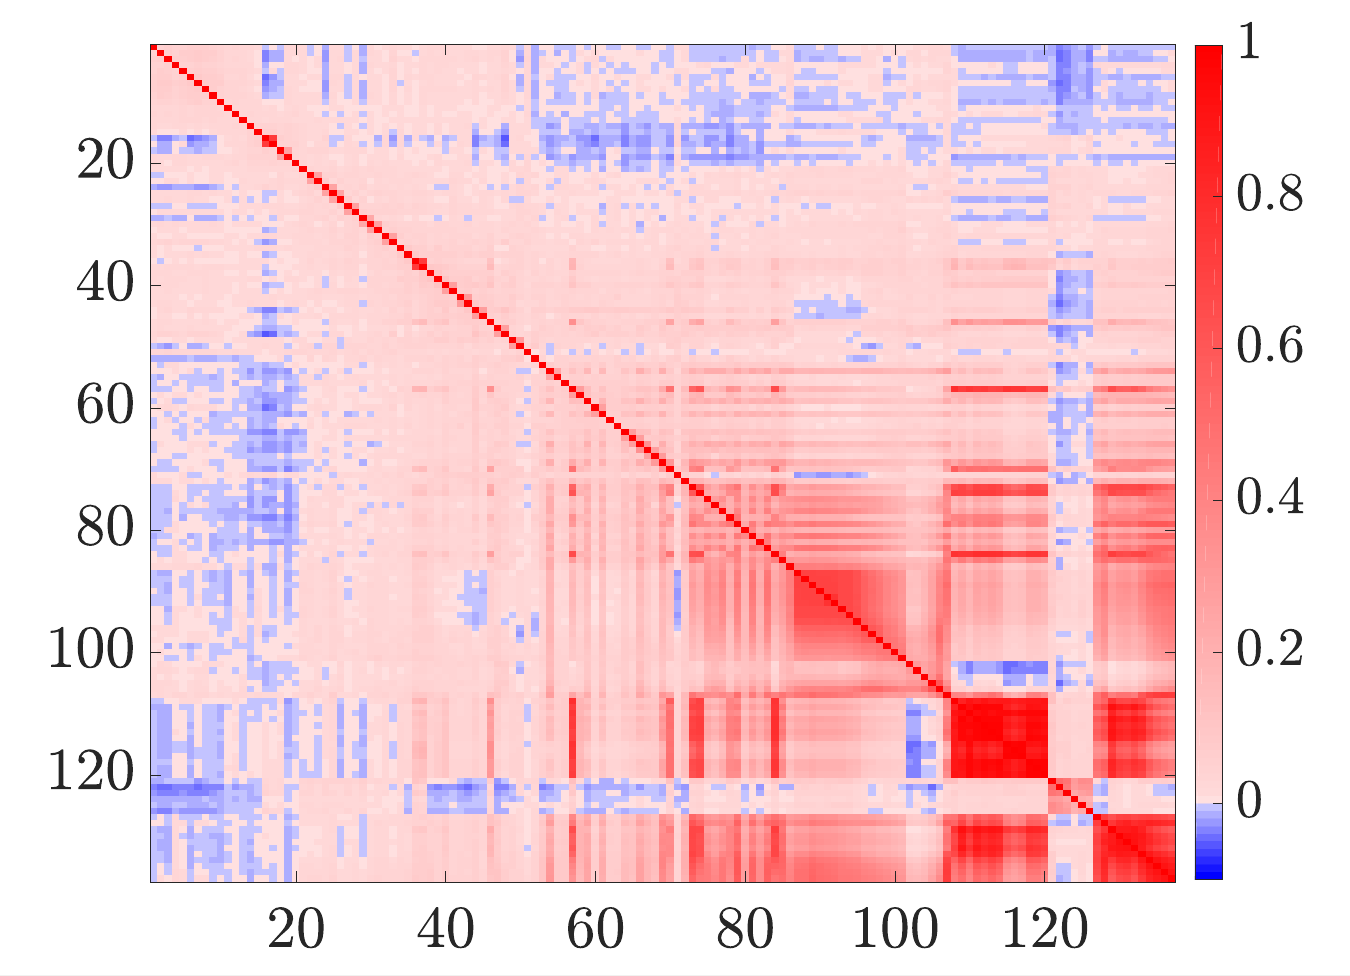
Caption: Error correlation information for IASI instrument. Dark colours indicate stronger relationships between errors for different channels of the instrument – often strong relationships occur between variables that measure similar things. We want to keep this structure, but change the values in a way that makes sure our computer system still runs quickly.
At the workshop I’ll be presenting new work that tests some of these methods using the Met Office system. Although we can improve the time required for our computations, using different error correlation information alters other parts of the system too! As we don’t know “true” values, it’s hard to know whether these changes are good, bad or just different. I’m looking forward to talking with scientists from other organisations who understand this data and can provide insight into what these differences mean. Additionally, as these methods are already being used to produce forecasts at meteorological centres internationally, discussions about the decision process and impact of different methods are bound to be illuminating!