A new study published in Global and Planetary Change by SPECIAL group PI Sandy Harrison and PhD student Xin Liu looks at how we can reconstruct population density across Northwest China. PhD student Xin Liu is jointly supervised by Prof. Sandy Harrison and Prof. Xiaozhong Huang of Lanzhou University. Xin recently spent a year at Reading with the SPECIAL research group. We thoroughly enjoyed having Xin in the office and wish him well for the rest of his PhD studies back in China!
Xin’s studies focus on reconstructing historical land use from both literature texts and from pollen data. Changes in population historically are important to understand as they influenced changes in vegetation and the natural environment, and therefore, the land use changes that occurred. We know that population change in China, specifically, was important due to historical international trade (e.g. the Silk Road) but the timing and location of these population changes are not well resolved. Resolving the spatial and temporal changes in population density is what Xin and colleagues address in the latest paper “Spatial reconstructions of population density in Northwest China between 2 and 1949 CE”.
Methods
There are two existing datasets that are commonly used to represent population density historically. These are the HYDE dataset and KK10 which convert population density to land use using a per-capita based estimate and then distribute this population using suitability mapping to determine areas of agriculture. Whilst this seems to perform okay at the national level, it is not always regionally reliable.
The present study by Liu et al. (2026) aims to use local data in addition to social and environmental factors to derive a gridded population dataset for Northwest China from 2 CE to 1949 CE. The use of non-traditional data sources such as historical texts allows the authors to gather more data but specifically, more regional measures of population. Combining this new dataset with social dynamics and climate changes allows the authors to map population change over time. These inputs were ultimately combined into a model that predicted the spatial distribution of the population at 0.5 arcmin resolution.
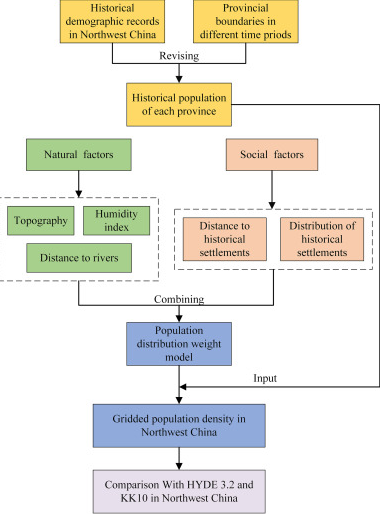
Figure 1: Flowchart showing the process used by the authors to derive their population reconstruction and comparison to existing products (source, Liu et al. 2026, Fig. 2, pg. 3).
Key Findings
The study shows that the population in Northwest China varied across time and that changes in both climate and society were largely responsible for the population changes seen. For example, the spatial patterns observed demonstrate the importance of the silk road and the access to water resources in terms of driving population hubs and distribution.
“Our results show that the population of Northwest China exhibited pronounced oscillations between 2 and 1949 CE, with repeated phases of rapid growth and abrupt decline. The minimum population 1.62 million people occurred in 140 CE, while the maximum of 17.73 million people was reached in 1862 CE. Population fluctuations were likely driven by climate change and social dynamics, including warfare, migration, and land reclamation.” (Liu et al. 2026 pg. 1)
The comparison to the two most popular existing datasets, HYDE 3.2 and KK10, indicates differences in magnitude for population reconstructions for Northwest China. However, all datasets exhibit similar long-term trends which can be divided into three key phases of population growth. A low population generally being observed pre 752 CE, a marked increase in 752 to 1644 CE and finally, a rapid increase post 1644CE. The reasons for differences between the datasets are explored in the main article text.
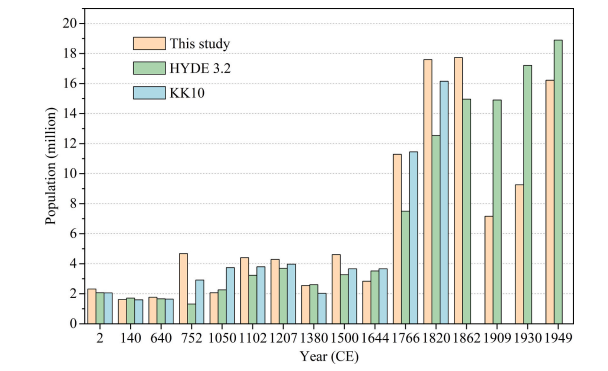
Figure 2: Comparison of total population in Northwest China over time as reconstructed by Liu et al. (2026), HYDE 3.2 and KK10. (source, Liu et al. 2026, Fig. 7, pg. 11)
Conclusion
Whilst there are biases towards the areas of Northwest China with the most data, this does provide a step forward in understanding historical regional populations in this area. The study also draws out the positive feedback mechanism between climate and society. For example, links between temperature and territorial expansion allowing for agricultural growth, more food and more people is highlighted. In contrast times of cooling align with social unrest and population decline. Links between the climate and agriculture seem to be very important for determining quality of life within a population and therefore, determining the overall population numbers.
For more detailed insights and further information on the sources used to derive these population estimates, as well as to see the spatially resolved population distributions, you can read the full text which is now available online.
See here:
Liu, X., Harrison, S.P., Min, R., Farqan, M., Zheng, M., Jiang, L., Li, H., Ma, M., Huang, X. 2026. Spatial reconstructions of population density in Northwest China between 2 and 1949 CE. Global and Planetary Change, https://doi.org/10.1016/j.gloplacha.2026.105375