Resources for Meteorologists are important to help with the preparation of historical climate information, as well as seasonal and short term forecasts.
R-INSTAT
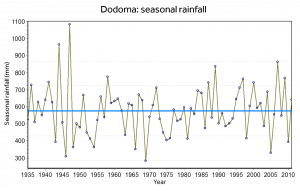
Meteorologists play a vital role in preparing historical climate information, as well as seasonal and short term forecasts in PICSA. R-INSTAT is a user-friendly interface with R programming, developed by Statistics for Sustainable Development. It is tailored for easy use with climate data, and especially useful for the historical climate data used in PICSA.
PICSA Approach Diagram
This diagram shows the different components of PICSA and how they all fit together to help farmers’ planning and decision-making. It also includes the two key principles of PICSA. It may be explained as follows:
- PICSA places farmers at the very centre of its approach. Farmers face significant challenges and opportunities that are associated with climate and weather, as well as other physical, social and economic factors
- The PICSA approach introduces climate information to farmers in the form of both historical climate data and seasonal and short-term forecasts.
- PICSA also helps farmers to consider locally available crop, livestock and livelihood options that could help them to deal with the challenges and opportunities they face.
- Finally, PICSA uses participatory decision-making tools to combine these elements and help farmers to make informed decisions.
- The principle of the ‘The Farmer Decides’ emphasises that farmers are best placed to make decisions about their agricultural practices, because they have detailed knowledge of their farm, system and environment, and they also face the consequences (whether favourable or unfavourable) of their decisions.
- The principle of ‘Options by Context’ recognises that different farmers work in different contexts (such as climate, land, assets, ambitions, and attitudes to risk). They should therefore make decisions that work best for their individual households.
PICSA Flow Chart
This diagram outlines all of the PICSA steps, beginning long before the season, continuing through the build-up to the season and during the season, and then ending after the season has finished. It shows the aim of each step, as well as how the steps all fit together as a whole. It can be used as both a reminder of the PICSA process for field staff, and for showing an overview of the process to farmers.