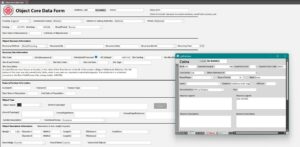
Since joining the REMADE team a year ago, I have been busy working on all things data within the project. My biggest task of the last year was developing and building the project’s relational database. This holds records for all the objects examined by the project, including find location, broader find site information, dating, object classification, owner/collection information, and detailed object descriptions. Each object record is linked to its corresponding pXRF and/or MP-AES analysis results. The database is also set up to automatically undertake some of the initial data processing and analysis steps. This includes processing the raw pXRF results by removing the balance and corrosion values and renormalising the remaining element values to recreate the metal. The database automatically assigns the type of copper alloy for each object based on the amounts and combinations of tin, zinc and lead, and assigns a copper space based on the amounts and combinations of arsenic, antimony, nickel and silver found in each analysis result.

Database
With the database build complete, I have been creating records for each object using the information gathered by Owen, the REMADE finds specialist, quality checking the MP-AES data, processing the pXRF data, and making sure that all these records are connected properly in the database.
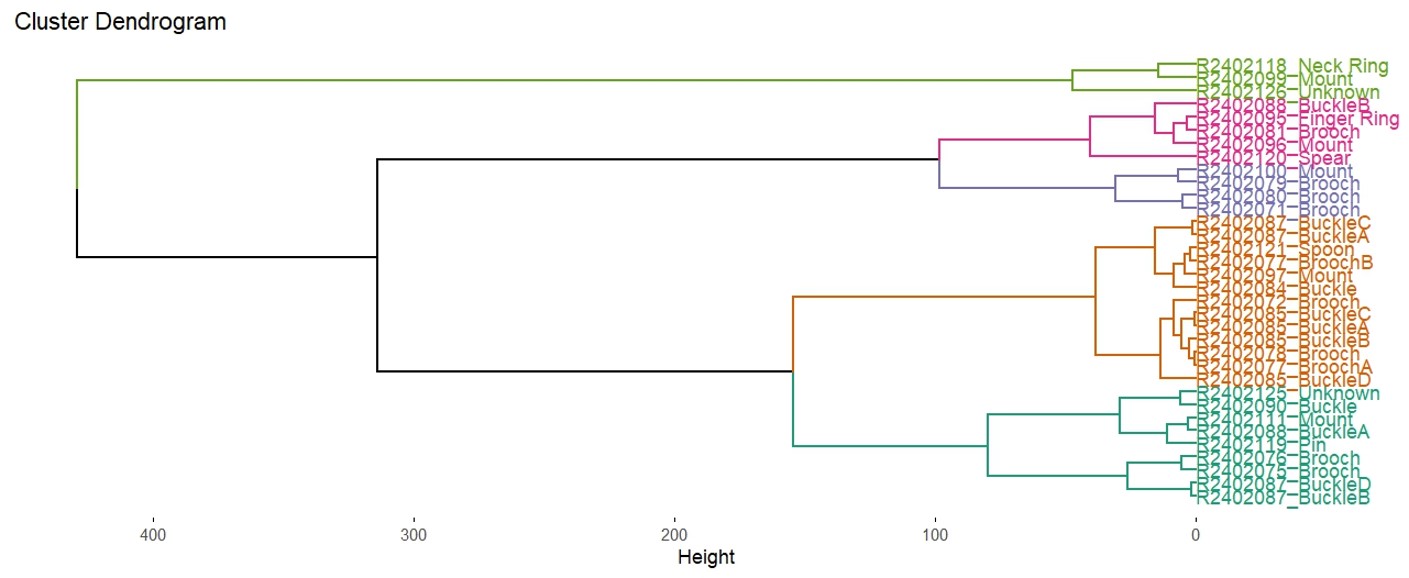
Now that the data storage and processing workflow is set up, I also have more time to explore the data analysis and visualisation side of things. For the last few weeks, this has looked like a deep dive into R programming, creating code that will be reusable for the length of the project, and ultimately allows for a more reproducible data analysis process. I have also started detailed explorations of principal component analysis, hierarchical clustering analysis, kernel density, and correspondence analysis. We want to fully understand how these statistical methods are working and find the best options for our data. For example, there are two different types of hierarchical clustering, agglomerative (aHCA) and divisive (dHCA), but within these two methods, there are also multiple options to determine the cluster breakdown. I have been looking into all these options, which for aHCA resulted in 48 different iterations of clustering, and for dHCA there are 7 iterations. I am looking into how well each of these different options clusters the data, what aspect of our chemical data is triggering an object or objects to be put into a cluster, and does clustering correspond to archaeological information for the objects in each cluster. Going forward, I will also start to explore ways of examining our data spatially, looking at spatial patterning of find types and how the chemistry of objects might change across a landscape.

Clustering
Sometimes I get to step away from the computer, and I have also been helping with photographing, pXRFing and sampling objects. As someone whose focus within archaeology has primarily been at a landscape scale, it has been fantastic to see, hold and learn more about so many amazing finds.

