by Tom Kent
- Background
Urban flooding is a major hazard worldwide, brought about primarily by intense rainfall and exacerbated by the built environment we live in. Leeds and Yorkshire are no strangers when it comes to the devastation wreaked by such events. The last decade alone has seen frequent flooding across the region, from the Calder Valley to the city of York, while the Boxing Day floods in 2015 inundated central Leeds with unprecedented river levels recorded along the Aire Valley. The River Aire originates in the Yorkshire Dales and flows roughly eastwards through Leeds before merging with the Ouse and Humber rivers and finally flowing into the North Sea. The Boxing Day flood resulted from record rainfall in the Aire catchment upstream of Leeds. To make matters worse, near-record rainfall in November meant that the catchment was severely saturated and prone to flooding in the event of more heavy rainfall. The ‘Leeds City Region flood review’ [1] subsequently reported the scale of the damage: “Over 4,000 homes and almost 2,000 businesses were flooded with the economic cost to the City Region being over half a billion pounds, and the subsequent rise in river levels allowed little time for communities to prepare.”
The Boxing Day floods and the lack of public awareness around the science of flooding led to the idea and development of the flood-demonstrator ‘Wetropolis’ (see Onno Bokhove’s previous DARE blog post). Wetropolis is a tabletop model of an idealised catchment that illustrates how extreme hydroclimatic events can cause a city to flood due to peaks in groundwater and river levels following random intense rainfall, and in doing so conceptualises the science of flooding in a way that is accessible to and directly engages the public. It also provides a scientific testing environment for flood modelling, control and mitigation, and data assimilation, and has inspired numerous discussions with flood practitioners and policy makers.
These discussions led us in turn to reconsider and analyse river flow data as a basis for assessing and quantifying flood events and various potential and proposed flood-mitigation measures. Such measures are generally engineering-based (e.g., storage reservoirs, defence walls) or nature-based (e.g., tree planting and peat restoration, ‘leaky’ woody-debris dams); a suite of these different measures constitutes a catchment- or city-wide flood-mitigation scheme. We aim to communicate this analysis and resulting flood-mitigation assessment in a concise and straightforward manner in order to assist decision-making for policy makers (e.g., city councils and the Environment Agency) and inform the general public.
- River data analysis and ‘flood excess volume’
Rivers in the UK are monitored by a dense network of gauges that measure and record the river level (also known as water stage/depth) – typically every 15 minutes – at the gauge location. There are approximately 1500 gauging stations in total and the flow data are collated by the Environment Agency and freely available to download. Shoothill’s GaugeMap website (http://www.gaugemap.co.uk/) provides an excellent tool for visualising this data in real-time and browsing historic data in a user-friendly manner. Flood events are often characterised by their peak water level, i.e. the maximum water depth reached during the flood, and statistical return periods. However, this flood-peak conveys neither the duration or the volume of the flood, and the meaning of return period is often difficult to grasp for non-specialists. Here, we analyse river-level data from the Armley gauge station – located 2km upstream from Leeds city centre – and demonstrate the concept of ‘flood-excess volume’ as an alternative diagnostic for flood events.
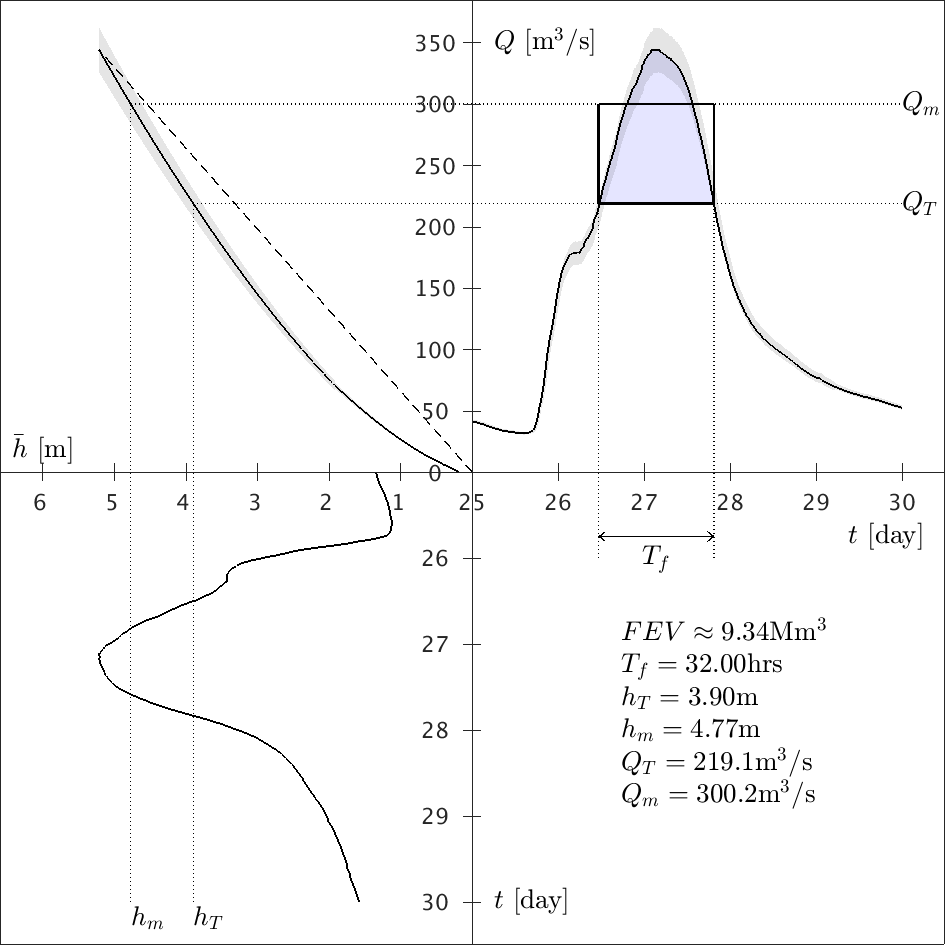
The bottom-left panel of Figure 1 (it may help to tilt your head left!) shows the river level (h, in metres) as a function of time in days around Boxing Day 2015. The flood peaked at 5.21m overnight on the 26th/27th December, rising over 4m in just over 24 hours. Another quantity of interest in hydrology is the discharge (Q), or flow rate, the volume of water passing a location per second. This is usually not measured directly but can be determined via a rating curve, a site-specific empirical function Q = Q(h) that relates the water level to discharge. Each gauge station has its own rating curve which is documented and updated by the Environment Agency. The rating curve for Armley is plotted here in the top-left panel (solid curve) with the dashed line denoting its linear approximation; the shaded area represents the estimated error in the relationship, which is expected to grow considerably when in flood (i.e., for high values of h). Applying the rating curve to the river level data yields the discharge time series (top-right panel, called a hydrograph) for Armley. Note that the rating curve error means that the discharge time series has some uncertainty (grey shaded zone around the solid curve). We see that the peak discharge is 330-360m3/s, around 300m3/s higher than 24 hours previously. Since discharge is the volume of water per second, the area under the discharge curve is the total volume of water. To define the flood-excess volume, we introduce a threshold height hT above which flooding occurs. For this flood event, local knowledge and photographic evidence suggested that flooding commenced when river levels exceeded 3.9m, so here we choose the threshold hT = 3.9m. This is marked as a vertical dotted line on the left panels: following it up to the rating curve, one obtains a threshold discharge QT = Q(hT) = 219.1m3/s (horizontal dotted line). The flood-excess volume (FEV) is the blue shaded area between the discharge curve and the threshold discharge QT. Put simply, this is the volume of water that caused flooding, and therefore the volume of flood water one seeks to mitigate (i.e., reduce to zero) by the cumulative effect of various flood mitigation measures. The FEV, here around 9.34 million cubic metres, has a corresponding flood duration Tf = 32 hours, which is the time between the river level first exceeding hT and subsequently dropping below hT. The rectangle represents the mean approximation to the FEV, which, in the absence of frequent flow data, can be used to estimate the FEV (blue shaded area) based on a mean water level (hm) and discharge (Qm).
- Using FEV in flood-mitigation assessment
Having defined FEV in this way, we are motivated by the following questions: (i) how can we articulate FEV (which is often many million cubic metres) in a more comprehensible manner? And (ii) what fraction of the FEV is reduced, and at what cost, by a particular flood-mitigation measure? Our simple yet powerful idea is to express the FEV as a 2-metre-deep square ‘flood-excess lake’ with side-length on the order of a kilometer. For example, we can break down the FEV for Armley as follows: 9.34Mm3 = (21502 x 2)m3, which is a 2-metre-deep lake with side-length 2.15km. This is immediately easier to visualise and goes some way to conveying the magnitude of the flood. Since the depth is shallow relative to the side-length, we can view this ‘flood-excess lake’ from above as a square and ask what fraction of this lake is accounted for by the potential storage capacity of flood-mitigation measures. The result is a graphical tool that (i) contextualises the magnitude of the flood relative to the river and its valley/catchment and (ii) facilitates quick and direct assessment of the contribution and value of various mitigation measures.
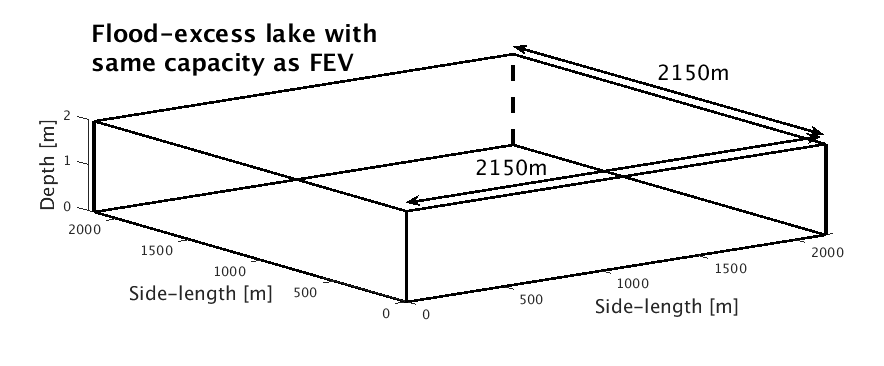 Figure 2 shows the Armley FEV as a 2m-deep ‘flood-excess lake’ (not to scale). Given the size of the lake as well as the geography of the river valley concerned, one can begin to make a ballpark estimate of the contribution and effectiveness of flood-plain enhancement for flood storage and other flood-mitigation measures. Superimposed on the bird’s-eye view of the lake in figure 3 are two scenarios from our hypothetical Leeds Flood Alleviation Scheme II (FASII+) that comprise: (S1) building flood walls and using a flood-water storage site at Calverley; and (S2) building (lower) flood walls and using a flood-water storage site at Rodley.
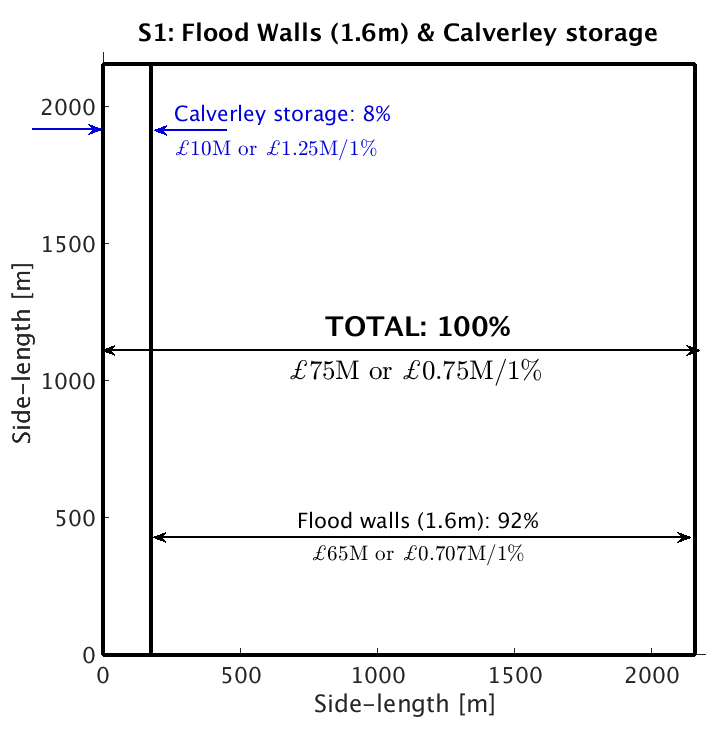
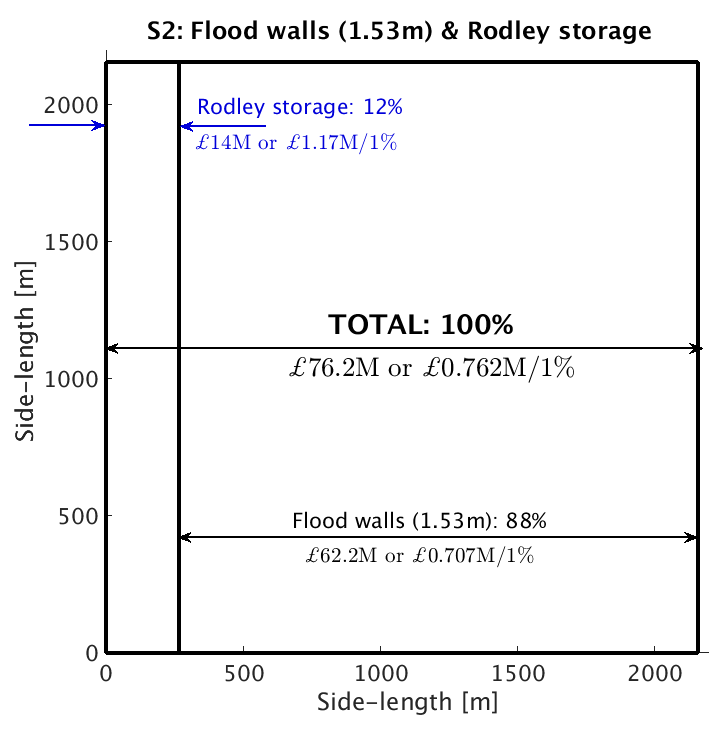
The available flood-storage volume is estimated to be 0.75Mm3 and 1.1Mm3 at Calverley and Rodley respectively, corresponding to 8% and 12% of the FEV. The absolute cost of each measure is incorporated, as well as the value (i.e., cost per 1% of FEV mitigated), while the overall contribution in terms of volume is simply the fraction of the lake covered by each measure. It is immediately evident that both schemes provide 100% mitigation and that (S1) provides better value (£0.75M/1% against £0.762M/1%). We can also see that although storage sites offer less value than building flood walls, a larger storage site allows lower flood walls to be built which may be an important factor for planning departments. In this case, although (S2) is more expensive overall, the Rodley storage site (£1.17M/1%) is better value than Calverley storage site (£1.25M/1%) and means that flood walls are lower. It is then up to policy-makers to make the best decision based on all the available evidence and inevitable constraints. Our hypothetical FASII+ comprises 5 scenarios in total and is reported in [2].
The details are in some sense of secondary importance here; the take-home message is that the FEV analysis offers a protocol to optimise the assessment of mitigation schemes, including cost-effectiveness, in a comprehensible way. In particular, the graphical presentation of the FEV as partitioned flood-excess lakes facilitates quick and direct interpretation of competing schemes and scenarios, and in doing so communicates clearly the evidence needed to make rational and important decisions. Finally, we stress that FEV should be used either prior to or in tandem with more detailed hydrodynamic numerical modelling; nonetheless it offers a complementary way of classifying flood events and enables evidence-based decision-making for flood-mitigation assessment. For more information, including case studies in the UK and France, see [2,3,4]; summarised in [5].
References:
[1] West Yorkshire combined Authority 2016. Leeds city region flood review report. December 2016. https://www.the-lep.com/media/2276/leeds-city-region-flood-review-report-final.pdf
[2] O. Bokhove, M. Kelmanson, T. Kent (2018a): On using flood-excess volume in flood mitigation, exemplified for the River Aire Boxing Day Flood of 2015. Subm. evidence-synthesis article: Proc. Roy. Soc. A. See also: https://eartharxiv.org/stc7r/
[3] O. Bokhove, M. Kelmanson, T. Kent, G. Piton, J.-M. Tacnet (2018b): Communicating nature-based solutions using flood-excess volume for three UK and French river floods. In prep. See also the preliminary version on: https://eartharxiv.org/87z6w/
[4] O. Bokhove, M. Kelmanson, T. Kent (2018c): Using flood-excess volume in flood mitigation to show that upscaling beaver dams for protection against extreme floods proves unrealistic. Subm. evidence-synthesis article: Proc. Roy. Soc. A. See also: https://eartharxiv.org/w9evx/
[5] ‘Using flood-excess volume to assess and communicate flood-mitigation schemes’, poster presentation for ‘Evidence-based decisions for UK Landscapes’, 17-18 September 2018, INI, Cambridge. Available here: http://www1.maths.leeds.ac.uk/~amttk/files/INI_sept2018.pdf