Summary
TAMSAT have pioneered the use of Meteosat satellite imagery for use in rainfall estimation across Africa since the 1980s, helping to provide skilful rainfall estimates and novel products to support rainfall monitoring and managing climate-related risk in conjunction with many African Meteorological Services and other organisations. The TAMSAT rainfall archive spans 1983 to the delayed present.
How do we estimate rainfall?
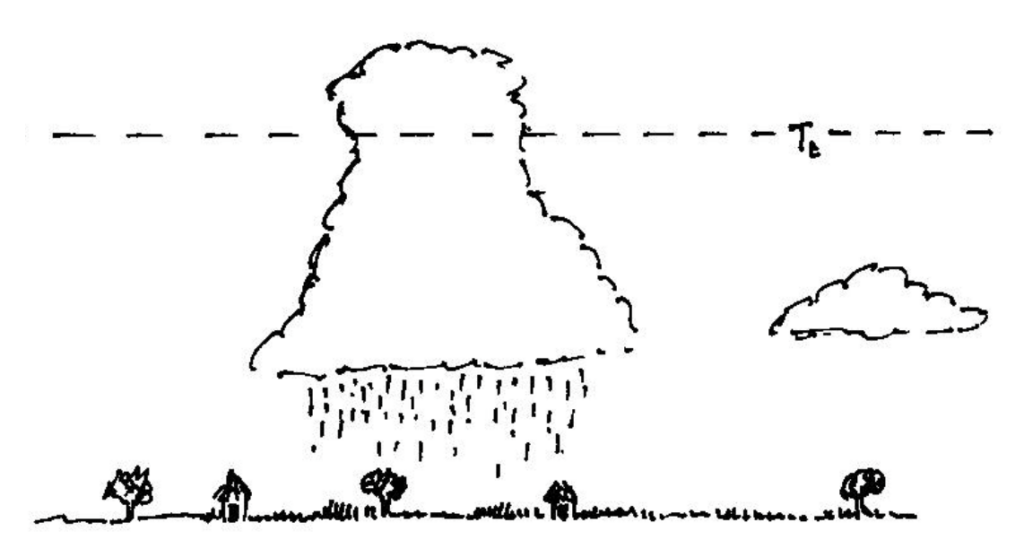
The TAMSAT method is based on the detection of precipitating storm clouds over Africa. Clouds with tops colder than a given threshold temperature (Tt) are assumed to be raining, while clouds with tops warmer than Tt are assumed not to be raining (schematic by David Grimes):
Detection of precipitating storm clouds over Africa can be achieved using thermal infra-red (TIR) imagery from the Meteosat satellites which can easily identify the storm clouds from the warm land surface below. This is evident in the latest Meteosat TIR image (10.8μm channel) shown below – the whitest areas denote the cold cloud tops of deep convective systems which are likely to be producing rainfall, while warmer scenes, such as low level cloud and the land surface are given as dark grey or black.

Using the satellite imagery, cold cloud duration (CCD) fields are calculated, where CCD is defined as the length of time the cloud top temperature is colder than Tt. The animation below illustrates how CCD fields are calculated from the TIR imagery using an arbitrary threshold of -50°C for the Sahel over a 10-day period. Over a given time interval, the length of time each satellite pixel is colder than -50°C is determined – this is CCD. In this example, CCD accumulates over the 10-day period. The map of CCD then becomes the proxy for rainfall showing where it has likely rained (i.e. where CCD is non-zero) and the likely magnitude of rainfall (i.e. high (low) CCD areas typically correspond to high (low) rainfall areas).
To convert CCD (units of hours) into rainfall estimates (units of mm), CCD is calibrated using rain gauges. Over sufficient time and space averaging, the relationship between rainfall and CCD is approximately linear.
A more complete overview of the TAMSAT rainfall estimation method is given in this open source book chapter in Satellite Precipitation Measurement (Maidment et al., 2020).
Dataset usage
TAMSAT rainfall estimates are used to support different sectors (e.g. climate, agriculture and finance) by monitoring rainfall conditions and identifying areas that are experiencing below or above average rainfall. The longevity of the rainfall dataset and the use of a constant estimation approach over time makes it especially suitable for risk assessment. Applications of the data include famine early warning, drought insurance and agricultural decision support.
Rainfall dataset overview
| Products |
- rainfall estimates
- rainfall anomaly estimates (relative to the 1983-2012 climatology)
|
| Latest version |
v3.1 (released 1st July 2020; see here for product release notes) |
| Time-step |
daily, pentadal, dekadal, monthly, seasonal*
*Seasons are 3-monthly totals calculated on a rolling 1-month basis; i.e. months 01–03 correspond to JFM, 02–04 to FMA, 03–05 to MAM, 04–06 to AMJ, 05–07 to MJJ, 06–08 to JJA, 07–09 to JAS, 08–10 to ASO, 09–11 to SON, 10–12 to OND, 11–01 to NDJ, and 12–02 to DJF. |
| Spatial domain |
African continent, including Madagascar (N: 38.025°, S: -35.9625°, W: -19.012°, E:51.975°) |
| Dimensions |
1974 pixels (latitude) by 1894 pixels (longitude) |
| Spatial resolution |
0.0375° (approx. 4km) |
| Temporal coverage |
1st January 1983 to present day |
| Latency |
within 2 days after each pentad – the products are created on the following days of each month;
- the daily and pentadal products are created on the 1st, 6th, 11th, 16th, 21st and 26th
- the dekadal products are create on the 1st, 11th and 21st
- the monthly products are created on the 1st
- the seasonal products are created on the 1st
|
| Data format |
netCDF |
| Available variables |
‘rfe‘, ‘rfe_filled‘
Due to missing satellite imagery, especially in the 1980s and 1990s, not all daily rainfall estimates could be generated. As such, we have filled in all missing days so that the rainfall record is temporally complete. So that it is clear what days have been recovered and those that have not, we have introduced an additional variable into the netCDF file – ‘rfe_filled‘ which contains estimates for all days, including those recovered. We recommend using ‘rfe_filled‘ if you need a temporally complete record, such as for time-series analysis or risk assessment.
The variable ‘rfe‘ are for days that have not been recovered and is therefore empty for such days. As such, we recommend any users who wish to use the most reliable data (e.g. for validation/assessment) to use this variable (rfe). Information about which files have been recovered can be found here. |
| Cost and Terms of use |
TAMSAT data are free to use and are released for operational, research and commercial use under the terms of the Creative Commons Attribution 4.0 International license (CC BY 4.0). To view a copy of this license, visit https://creativecommons.org/licenses/by/4.0/. |
| Citation |
Please cite the following papers if using TAMSAT rainfall estimates:
- Maidment, R. I., D. Grimes, E. Black, E. Tarnavsky, M. Young, H. Greatrex, R. P. Allan et al. (2017). A new, long-term daily satellite-based rainfall dataset for operational monitoring in Africa Nature Scientific Data 4: 170063 DOI:10.1038/sdata.2017.63.
- Tarnavsky, E., D. Grimes, R. Maidment, E. Black, R. Allan, M. Stringer, R. Chadwick, F. Kayitakire (2014). Extension of the TAMSAT Satellite-based Rainfall Monitoring over Africa and from 1983 to present Journal of Applied Meteorology and Climate DOI 10.1175/JAMC-D-14-0016.1
- Maidment, R., D. Grimes, R.P.Allan, E. Tarnavsky, M. Stringer, T. Hewison, R. Roebeling and E. Black (2014). The 30 year TAMSAT African Rainfall Climatology And Time series (TARCAT) data set Journal of Geophysical Research DOI: 10.1002/2014JD021927
|