by Tom Kent, University of Leeds
Recently, the DARE team at the University of Leeds contributed written evidence to the UK Parliament’s flooding inquiry to inform policy on the Government’s approach to managing flood risk in England. The evidence, which can be found online here in a document entitled ‘A new tool for communicating cost-effectiveness of flood-mitigation schemes’, focusses on a novel and innovative way of visualising and analysing complex flood-mitigation schemes. The submitted evidence draws heavily on the concept of flood-excess volume (loosely speaking the amount of water causing flood damage) and the Wetropolis flood demonstrator; it is enhanced further by a bespoke flood-evacuation plan for local businesses in Leeds which has been implemented during Storm Ciara in February 2020 and is based on its ad-hoc use during the 2015 Boxing Day floods.
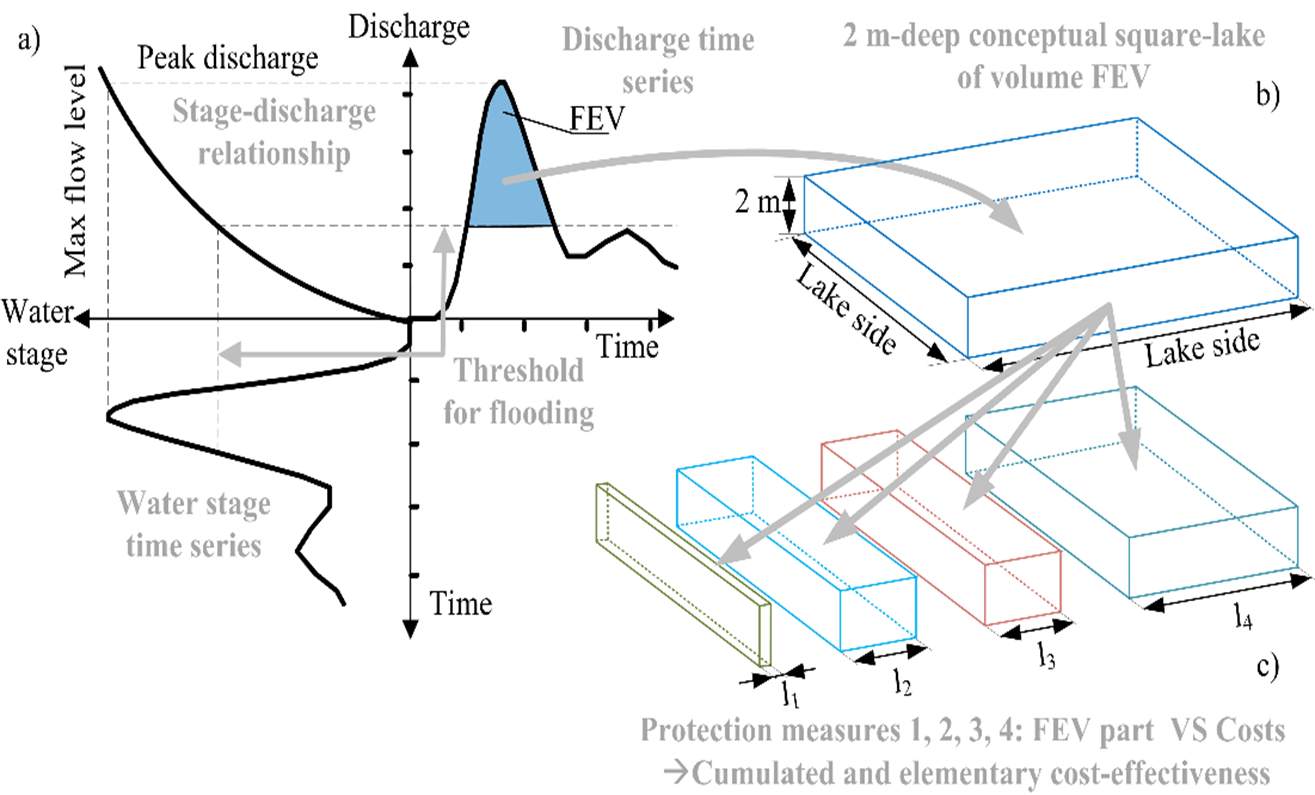
This work grew from a challenge posed by a representative of the Environment Agency (EA) in the UK, who asserted that mathematicians generally explain things in terms of incomprehensible equations and wanted something that was more accessible to non-mathematicians! The new tool therefore deliberately avoids equations and scientific jargon and instead uses a graphical display that shows, as a hypothetical square lake 2 metres deep, the amount of water that needs to be contained in a river valley to stop a river from flooding. The graphic (see the figure below) is overlaid with the various options necessary to hold back or to capture the floodwaters, and, more crucially for the purposes of strategic decision-making, how much each option will cost. The tool is designed to help both the public and policymakers grasp the headline options and trade-offs inherent in flood-mitigation schemes. It has recently been used in France and Slovenia, where it has been well-received by the stakeholders involved.
Fig. 1: Schematic diagram of the combined conceptual flood-excess volume (FEV) and cost-effectiveness tool (see also the previous FEV blog). (a) Three-panel graph highlighting FEV: (bottom-left) view of river-level time series around a flood event; (top-left) stage-discharge relationship arising from (top-right) discharge data, in which FEV is the blue-coloured “area” between the discharge curve, displayed vertically as function of time horizontally, and a chosen threshold discharge over the duration of the floods, involving in-situ temporal river levels as function of time. (b) FEV square-lake representation as a 2-metre-deep square lake, with side-length “Lake side” being the square root of half the FEV (i.e. FEV divided by 2 metres), to facilitate visualisation of FEV “size”. (c) cost-effectiveness computed for each measure, here four, as an equivalent FEV fraction, represented as side lengths l1, l2, l3 and l4 of the square lake.
Most of the foundations of this policy submission have been laid in the last couple of years within the DARE project. In addition to the evidence submission, and stimulated by requests from researchers around the world, we have also set up a ‘Flood-Excess Volume’ GitHub site with a number of case studies from recent floods in the UK and France. For each case study, we provide the data and source code to carry out the analysis as well as a summary of the output and links to further information. Keep an eye out for further updates in the future, including excel files, which we hope will increase accessibility and widen the applicability of the tool.