Although quantitative isotopic data from speleothems has been used to evaluate isotope-enabled model simulations in the past, currently no consensus exists regarding the most appropriate methodology through which achieve this. Motivated by the fact that a number of modelling groups will be running isotope-enabled palaeoclimate simulations in the framework of the Coupled Model Intercomparison Project Phase 6, we have explored different approaches on how to use speleothem data for data-model comparisons in a paper that is now open for discussion at Climate of the Past Discussions (https://www.clim-past-discuss.net/cp-2019-25/):
Comas-Bru, L., Harrison, S. P., Werner, M., Rehfeld, K., Scroxton, N., Veiga-Pires, C., and SISAL working group members: Evaluating model outputs using integrated global speleothem records of climate change since the last glacial, Clim. Past Discuss., 2019, 1-53, 10.5194/cp-2019-25, 2019.
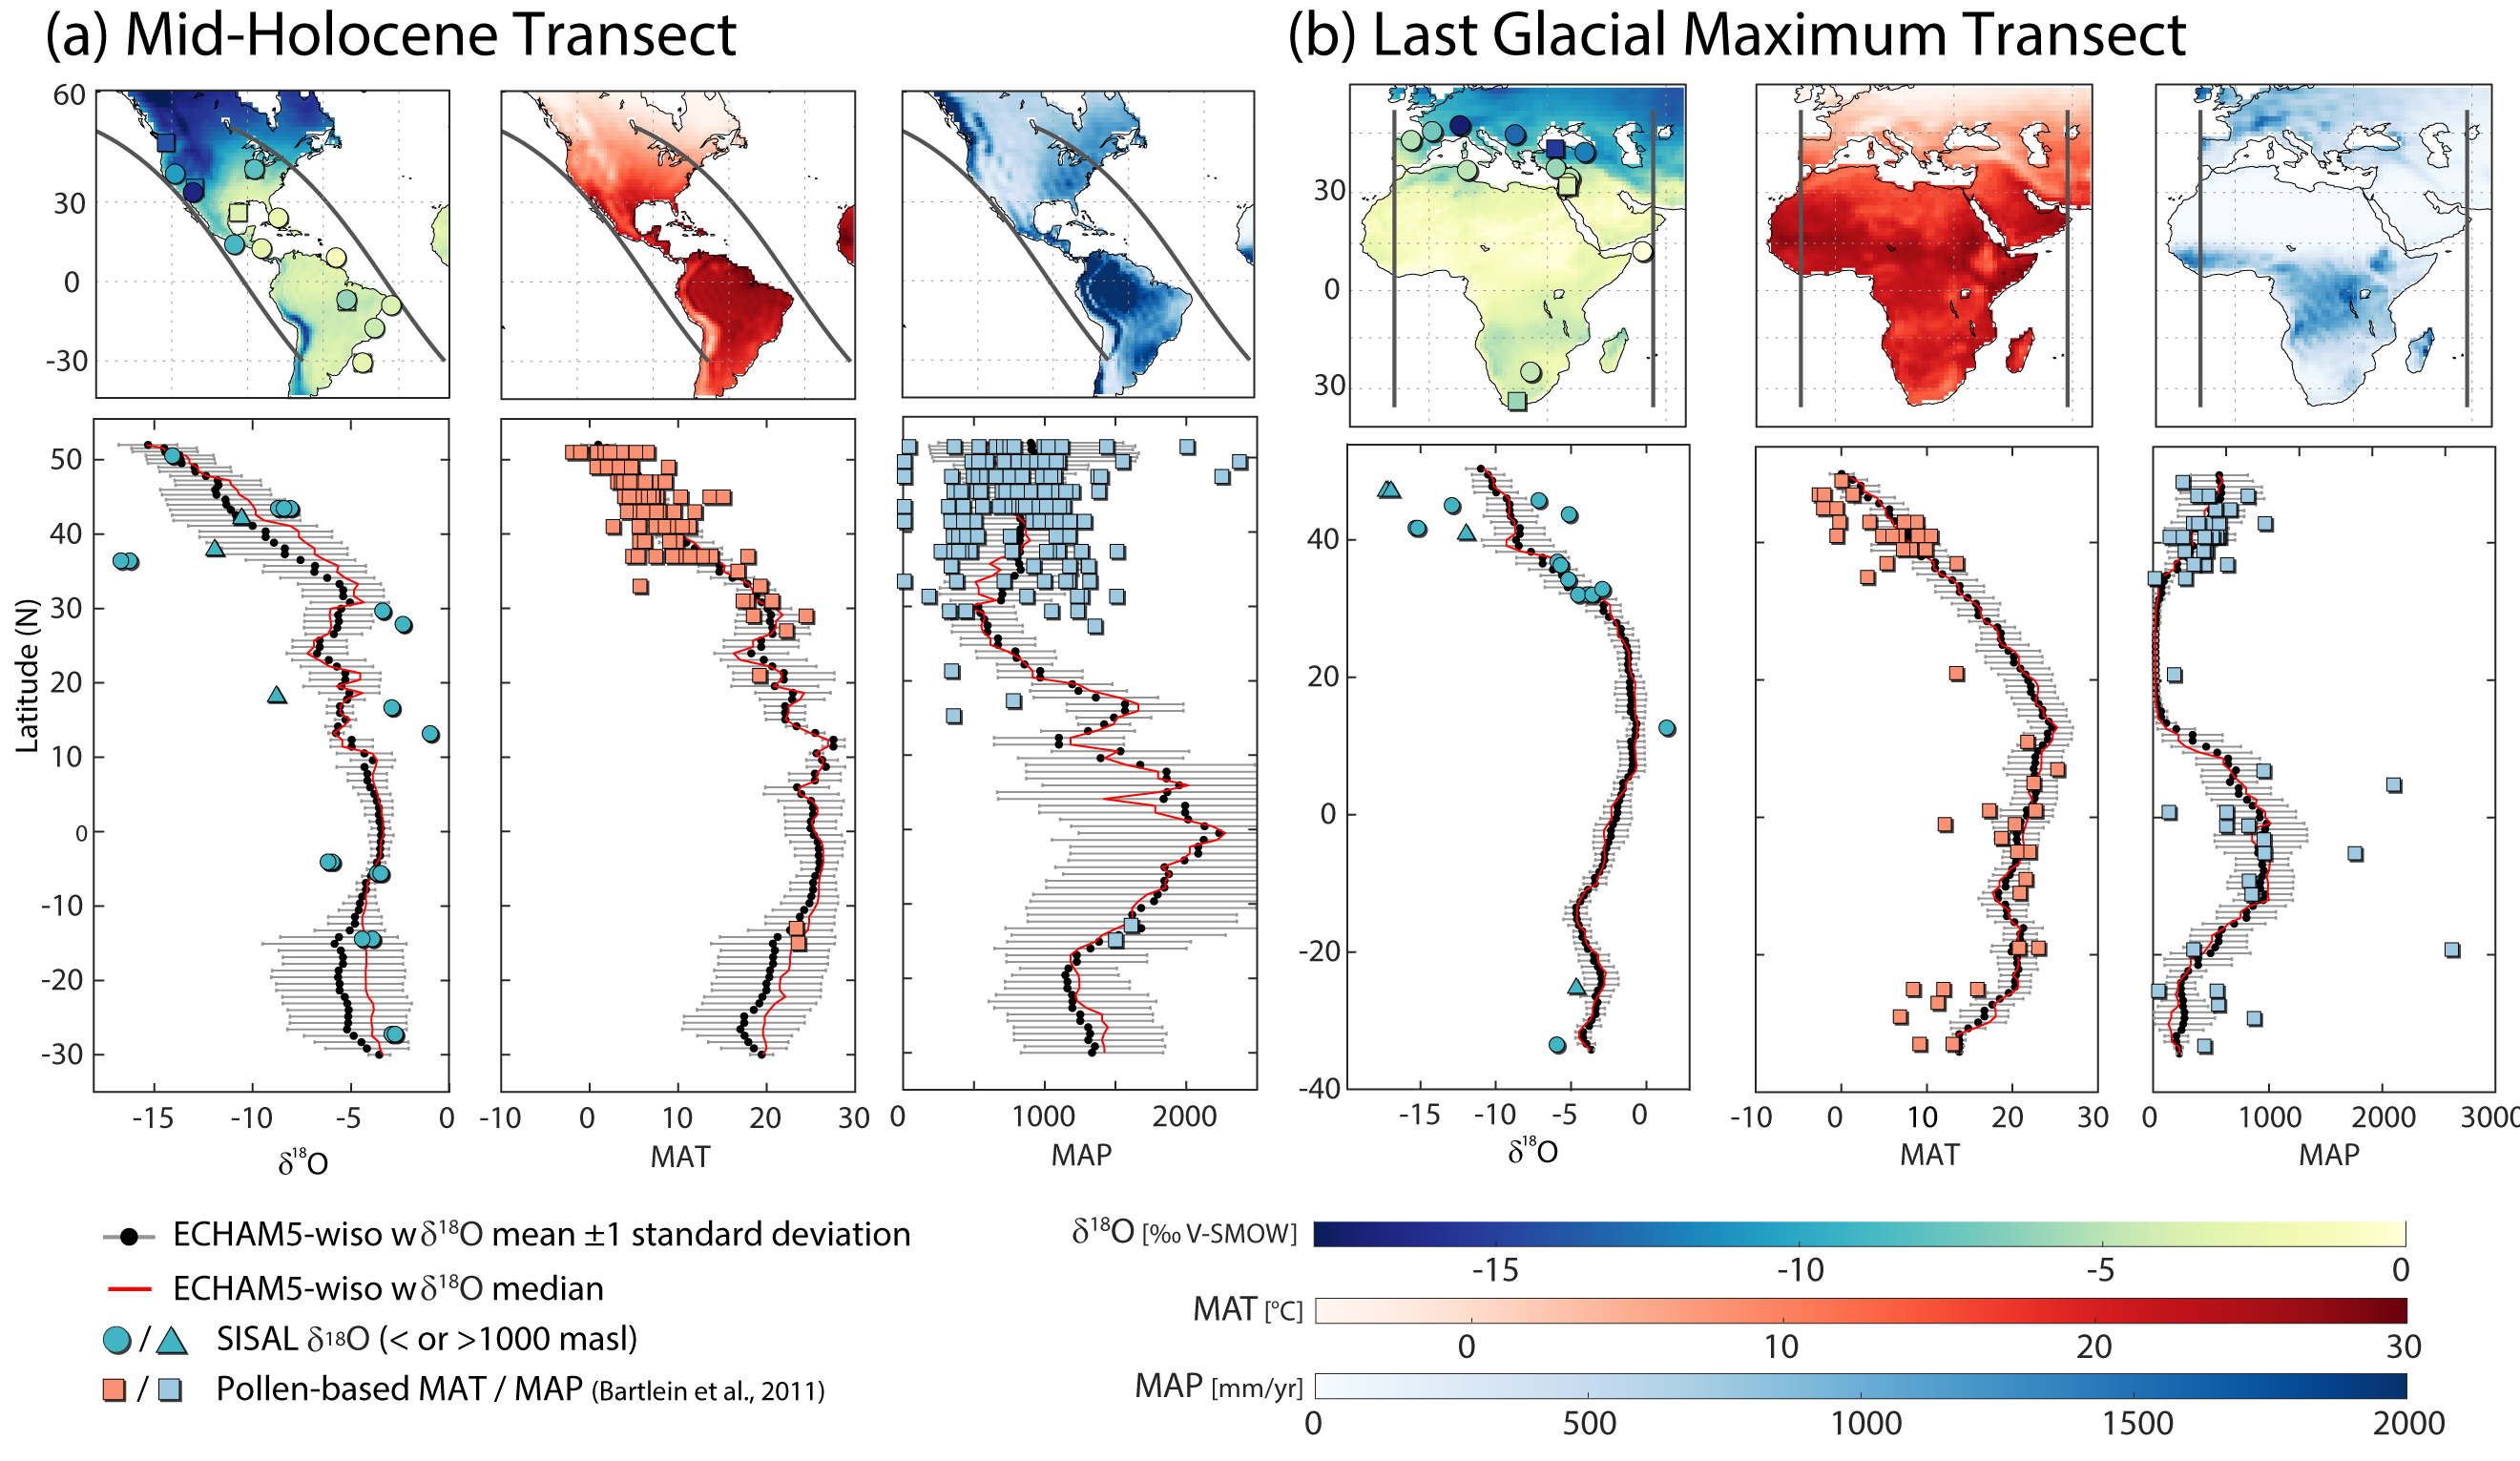
In this study, we show that the SISAL database reproduces the first-order spatial patterns of isotopic variability and is therefore useful to assess a model’s ability to simulate spatial isotopic trends. Our analyses provide a protocol for using speleothem isotopic data for model evaluation, including screening the observations, the optimum period for the modern observational baseline, and the selection of an appropriate time-window for creating means of the isotope data for palaeo time slices.
Figure 1 shows an example on how to circumvent the issue of speleothem records being discontinuous in nature, which complicates procuring large numbers of records if data-model comparisons are made using the traditional approach of comparing anomalies between a control period and a given palaeoclimate experiment. This example illustrates a technique through which the absolute isotopic values during any time period could be used for model evaluation.
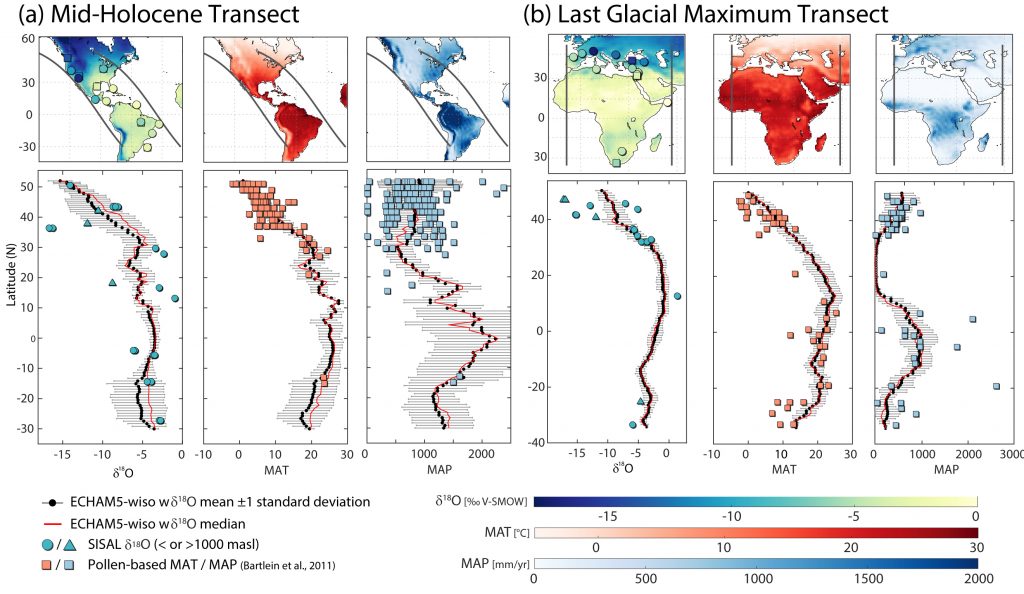
Bartlein, P. J., Harrison, S. P., Brewer, S., Connor, S., Davis, B. A. S., Gajewski, K., Guiot, J., Harrison-Prentice, T. I., Henderson, A., Peyron, O., Prentice, I. C., Scholze, M., Seppä, H., Shuman, B., Sugita, S., Thompson, R. S., Viau, A. E., Williams, J., and Wu, H.: Pollen-based continental climate reconstructions at 6 and 21 ka: a global synthesis, Climate Dynamics, 37, 775-802, https://doi.org/10.1007/s00382-010-0904-1, 2011.
Harris, I., Jones, P. D., Osborn, T. J., and Lister, D. H.: Updated high-resolution grids of monthly climatic observations – the CRU TS3.10 Dataset, International Journal of Climatology, 34, 623- 642, https://doi.org/10.1002/joc.3711, retrieved from https://crudata.uea.ac.uk/cru/data/hrg/cru_ts_4.01/ on November 2018, 2014.