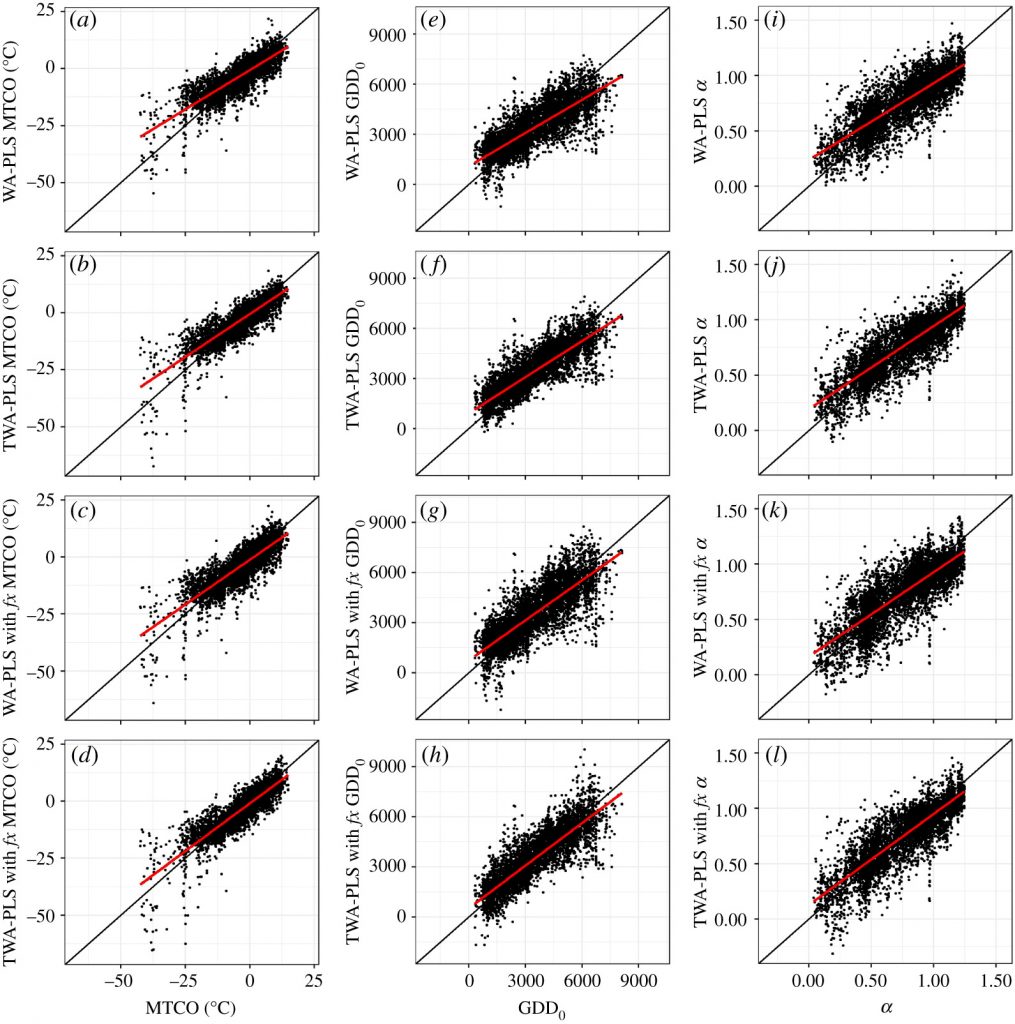
How to know the climates at the remote past? Unfortunately, we don’t have a time machine to go back and measure them. We have to infer them from some indicators. Weighted averaging partial least-squares regression (WA-PLS) is one of the most widely used methods to reconstruct past climates from biotic indicators such as pollen, chironomids and diatoms. However, it has a strong bias: values reconstructed from the training dataset tend to be higher than observed values at the low end, and lower at the high end, of the climate range. This artificial ‘compression’ towards the central part of the range occurs whatever biotic indicator is being used.
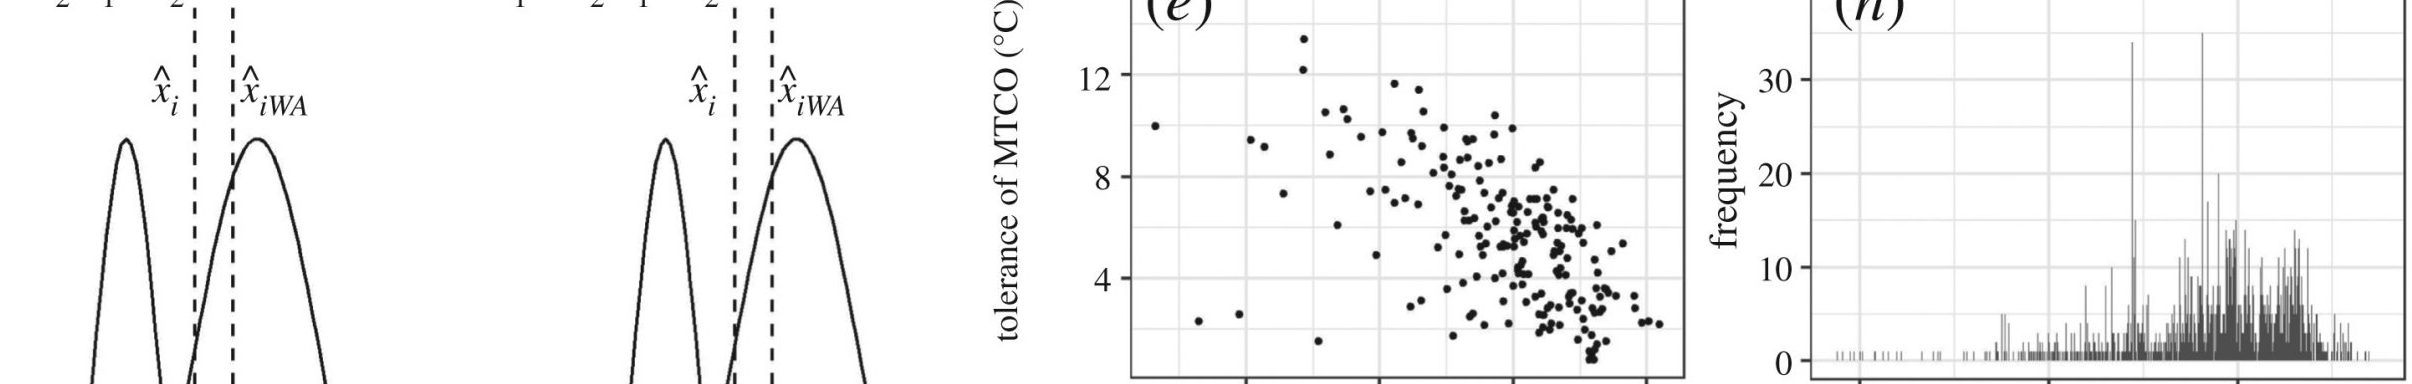
Therefore, we motivate an improved version of WA-PLS, making use of information about the climatic tolerances of taxa (t), which vary considerably—taxa with narrow climatic ranges have greater indicator value than taxa with wide climatic ranges. Climate values that occur frequently in the training dataset might also cause bias, so we further improve the model by taking the frequency of climate values (fx) into account. Using a large modern pollen dataset from Europe, the Middle East and northern Eurasia, we show that the new method reduces the compression bias, decreases root mean square error of prediction (RMSEP) and increases R2. Check our newly published paper in Proceedings of the Royal Society A (https://doi.org/10.1098/rspa.2020.0346) for details.