The narrow-wide pattern of tree-ring width records past climate change, which makes tree-ring width a major archive for the palaeo climate reconstruction, especially for the last millennium. To use tree-ring width for climate reconstruction, the ontogenetic signal, which is that a young tree grows faster than an older tree does, needs to be removed. This data preparation step is called “detrending”. However, almost all of the existing detrending methods are not immune to the sampling bias of age distribution (Fig. 1). Inevitably, field sampling focuses on long-lived trees in order to obtain as long a record as possible. Shorter-lived trees from earlier years have often disappeared by the time of sampling. Therefore there is a potential bias, such that growth rings from old, more slowly growing trees tend to be over-represented in the data for more recent years, while growth rings from younger, faster-growing trees tend to be over-represented in the data for earlier years. One potential consequence is that recent environmental trends in tree growth, which could be caused (for example) by the recent rapid increase in atmospheric [CO2] and/or global temperature increases, may be removed as an accidental by-product of detrending. This could further have influence on the quality of climate reconstruction using tree-ring widths.

Thus, we have developed a new approach to derive a productivity index (P*) from tree-ring series. The critical stem diameter, when an initial rapid increase in stem radial growth gives way to a gradual decrease, is estimated using a theoretical approximation; previous growth rings are removed from analysis. The subsequent dynamics of stem radial growth are assumed to be determined by: tree diameter and height; P* (gross primary production per unit leaf area, discounted by a “tax” due to the respiration and turnover of leaves and fine roots); and a quantity proportional to sapwood specific respiration (r1). P* values were then estimated from tree ring-width measurements on multiple trees, using a non-linear mixed-effects model in which the random effect of individual tree identity accounts for the impact of local environmental variability, due to soil or hydrological conditions, and canopy position (i.e. shading and competition). Year-by-year P* at a site should then represent the influence of year-by-year changes in environment, independently of the growth trend in individual trees. This approach was applied to tree-ring records from two genera (Picea and Pinus) at 492 sites across the Northern Hemisphere extratropics. Using a multiple linear mixed-effects regression with site as a random effect, Fig. 2 shows that estimated annual P* values for both genera show consistent, temporally stable positive responses of P* to total photosynthetically photon flux density during the growing season (PPFD5) and soil moisture availability (indexed by an estimate of the ratio of actual to potential evapotranspiration). The partial effect of mean temperature during the growing season (mGDD5) however was shown to follow a unimodal curve, being positive in climates with mGGD5 < 9 to 11 ˚C, and negative in warmer climates.

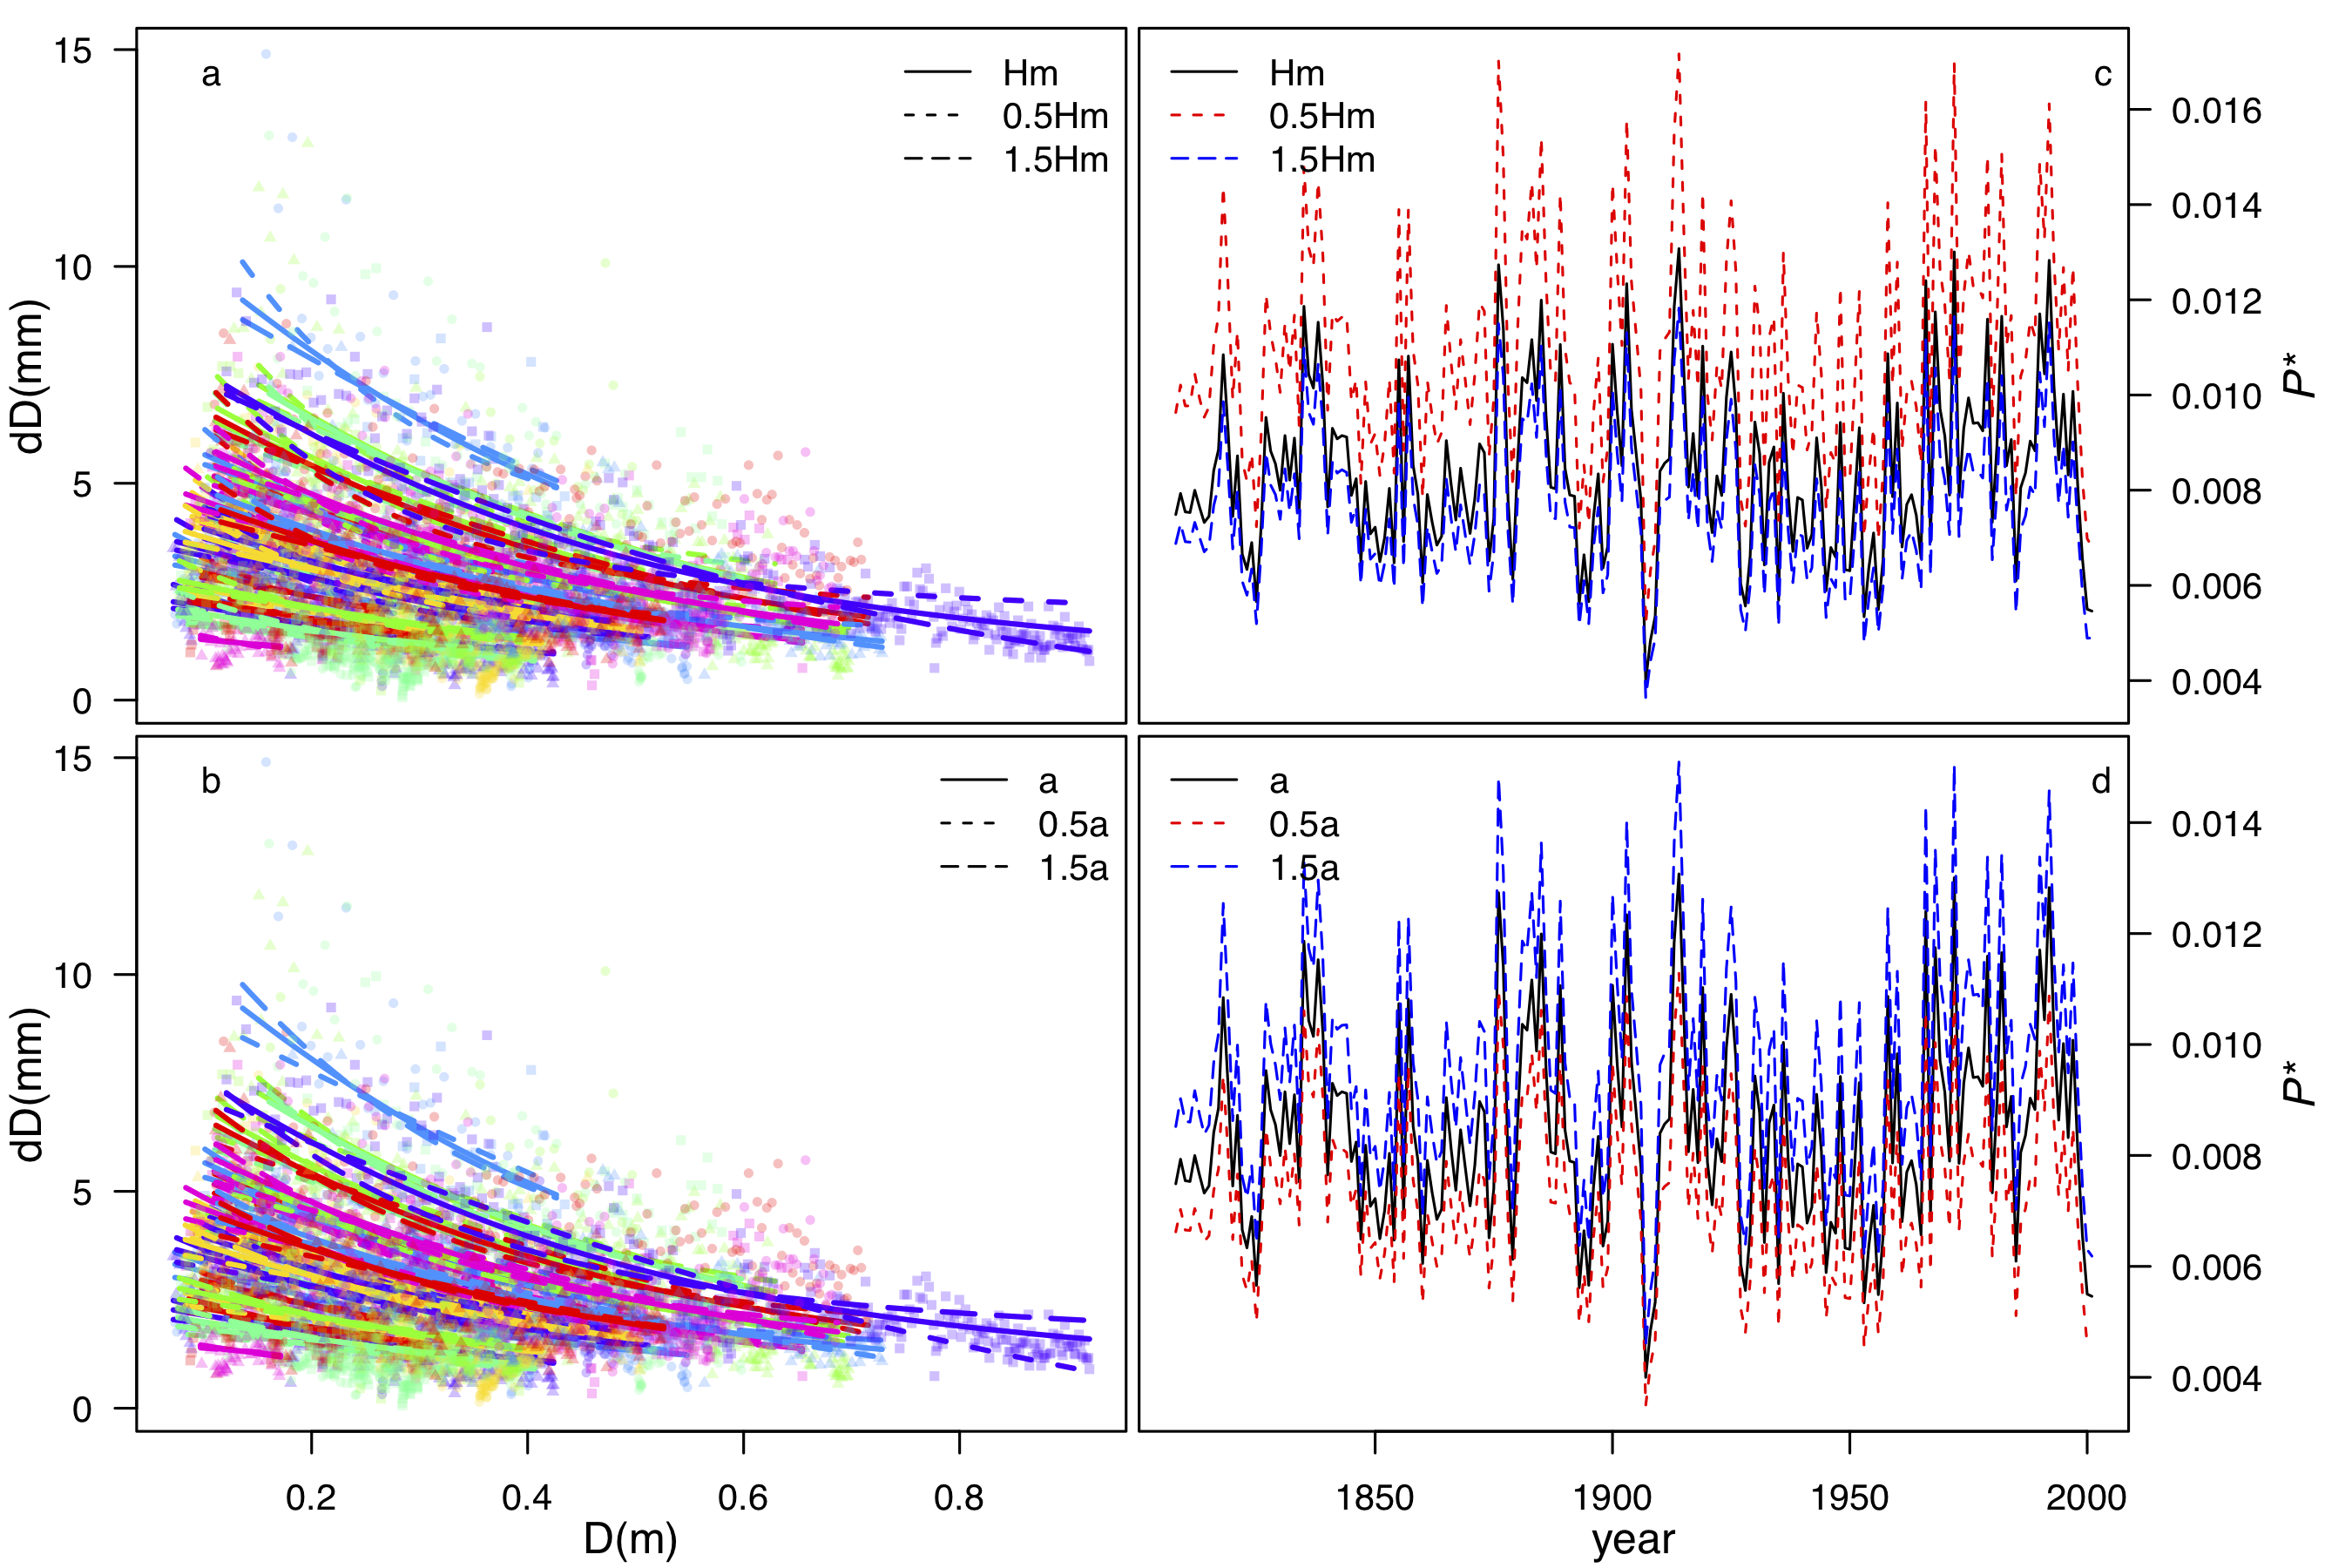
Estimating P* from tree-ring –width data is very simple. It only requires two parameters for P* estimation, which is the height-diameter relationship (a), and the maximum tree height (Hm). Those two parameters can be estimated from independent observations for species/genera. Impact on the final P* are fairly small. Correlation between different P*s, generated by using large ranges of a and Hm (±50%), are all higher than 0.98 (Fig.3). Thus, this method has the potentiality for tree-ring research globally. This paper is currently under review as the discussion paper in Biogeosciences Discussion (https://doi.org/10.5194/bg-2019-63).
