The P model is increasingly at the centre of work that we are doing in the SPECIAL group, forming the basis for work on past vegetation productivity, peatland growth and crop modelling. So, it is great that the “definitive” paper outlining the theory behind this model and testing its performance under modern conditions, led by Beni Stocker at ETH, has now been published in Geoscientific Model Development (https://doi.org/10.5194/gmd-13-1545-2020). The P model is one of a new crop of simple models rooted in eco-evolutionary optimality theory. Eco-evolutionary optimality theory is based on identifying trade-offs that plants are required to make in order to function, for example between CO2 uptake and water loss through transpiration. It therefore requires the explicit formulation of hypotheses about specific trade-offs that can be expressed mathematically and then explicitly tested. This optimality approach should not be confused with the idea of optimisation; it is not about the empirical optimisation of model parameters.
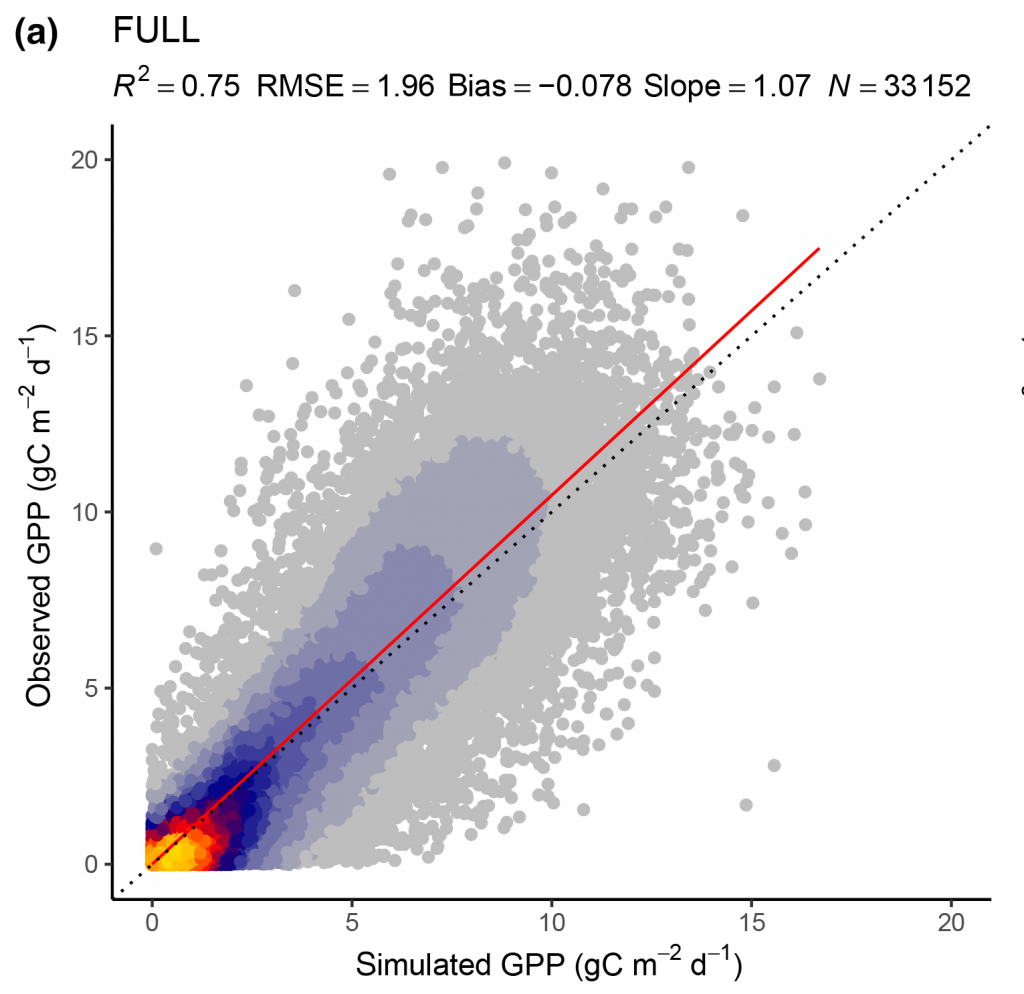
Correlation of observed and modelled GPP values of all sites pooled, mean over 8 d periods, for the FULL model setup.
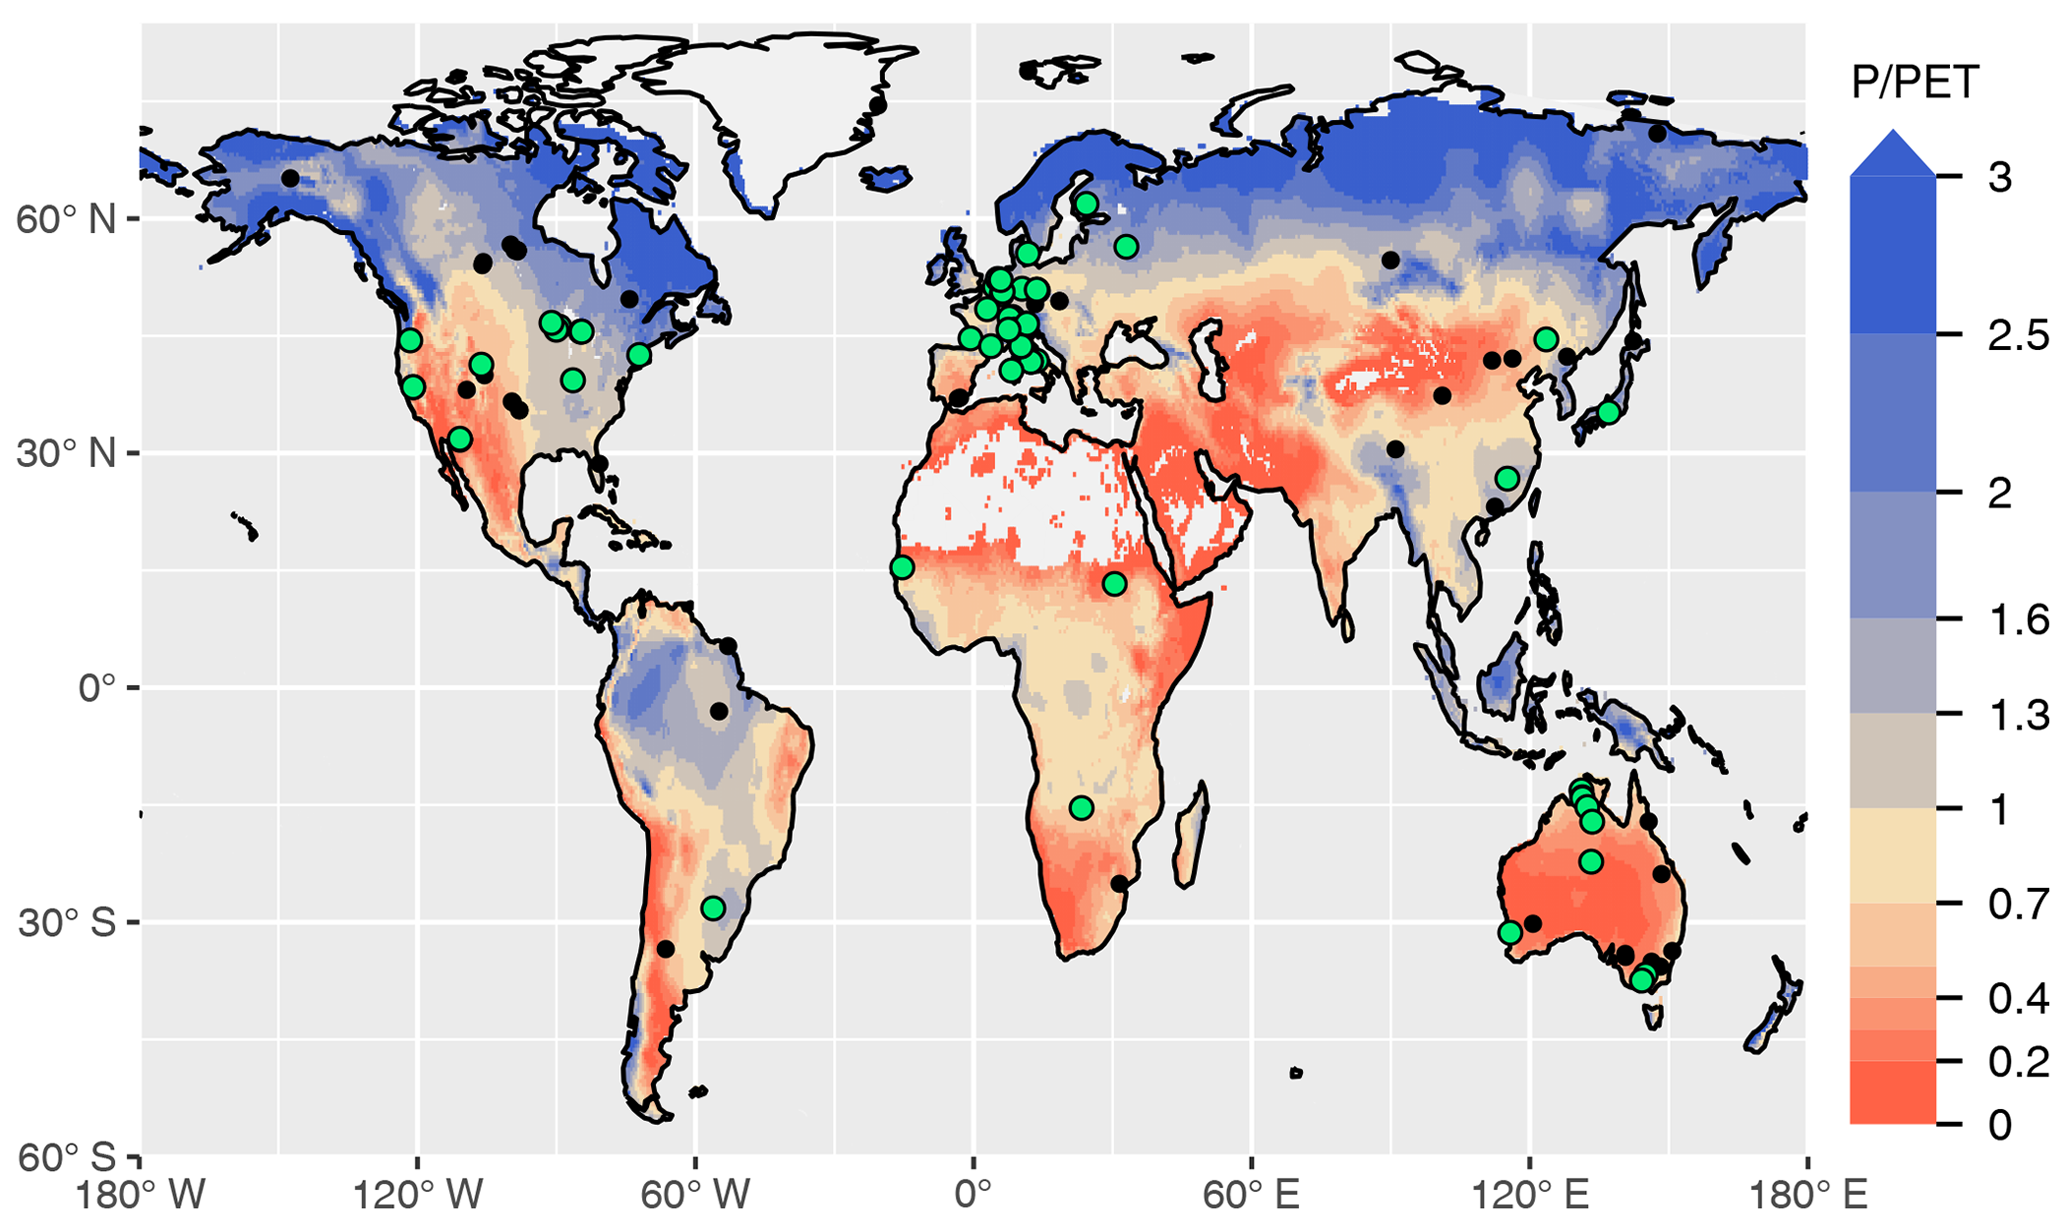
In these days of “working from home” and “self-isolation” it’s worth noting that the P model is the result of a long-term virtual collaboration by the so-called NextGen vegetation modelling group, with members from the Europe, the US and China. While this makes the monthly group meetings a scheduling nightmare – with people having to get up early or stay up late in order to participate — the outcome is an exciting and novel way of modelling vegetation. The NextGen group will to continue to extend the P model. As part of her PhD, Guilia Mengoli is working towards incorporating the P model in the ECMWF land-surface scheme. Anne Quillet is working on evaluating how well the P model simulates peatland productivity, as a first step towards using it in a new model of peatland growth. The P model is also the starting point for Shengchao Qiao‘s crop modelling work and the underlying theory is being used by Huiying Xu in her analysis of trait variability along climate and elevation gradients in the Gongga Mountains. We expect to see many spin-offs from the P model in coming months!