By: Amos Lawless
“Mmm this cake is lovely, what’s in it?” “Try to guess!” How often have we had that response from a friend or colleague who is proud of the cake they have just baked? And we usually try to guess the main ingredients – “I think there must be ginger or cinnamon. And can I taste lemon?”. But what if that friend persisted and asked you to try to guess all the ingredients – how many eggs they have used, how many grams of sugar are in the cake and how much butter it contains? Maybe you’d think they’d gone a bit crazy! Surely it is impossible to work out all the ingredients just by tasting it? It may sound unreasonable, but this is effectively what we try to do each day to interpret satellite measurements for our weather forecasts.
Weather satellites, besides giving us the nice pictures that we see on television, provide a wealth of other information about the atmosphere. Satellites actually measure the radiation emitted from the atmosphere at different frequencies, and these measurements depend on the properties of that part of the atmosphere that the satellite is looking at, such as its temperature, humidity and winds. It is as if these “ingredients” of the atmosphere are brought together into a “cake” that the satellite can taste. But what we are really interested in knowing is these ingredients. So how can we split the satellite measurement back into its atmospheric ingredients?
Thankfully we have a mathematical technique for doing this, which we call data assimilation. Each satellite instrument can measure at many different frequencies (as if they have many “taste buds” sensitive to different ingredients), so by combining measurements from different satellites in an intelligent way, as well as other more conventional measurements made on the ground, data assimilation helps us to build up a complete picture of the atmosphere all around the globe. This is done every day as part of modern weather forecasting, since knowing what the atmosphere is like now is essential if we are to make accurate forecasts. Most data assimilation techniques are based on finding an optimal combination of what we think is the current state of the atmosphere and our measurements, taking into account the precision of the different pieces of information we have. Writing down the theory of how to do this is fairly easy, but putting into practice is usually much harder.
Scientists of the Data Assimilation Research Centre (DARC) at the University of Reading work on a variety of problems related to data assimilation, from developing new approaches to applying it in practice. Each year, jointly with the National Centre for Earth Observation (NCEO), we organise a training course for scientists round the world to learn about the theory of data assimilation and how to apply it in practice. Lectures from DARC scientists are combined with computer practical exercises, so that participants can learn the theory of data assimilation and get a feel for how different methods perform in practice. Normally the course is held in-person, but this year there was the challenge of whether it was possible to hold it online. So it was that at the start of May our first ever training course on data assimilation using Microsoft Teams took place. Joining were 29 scientists from the UK, Belgium, Bulgaria, Denmark, Germany, Greece, Italy, Spain and the USA, working in universities, research institutes and meteorological forecasting centres.

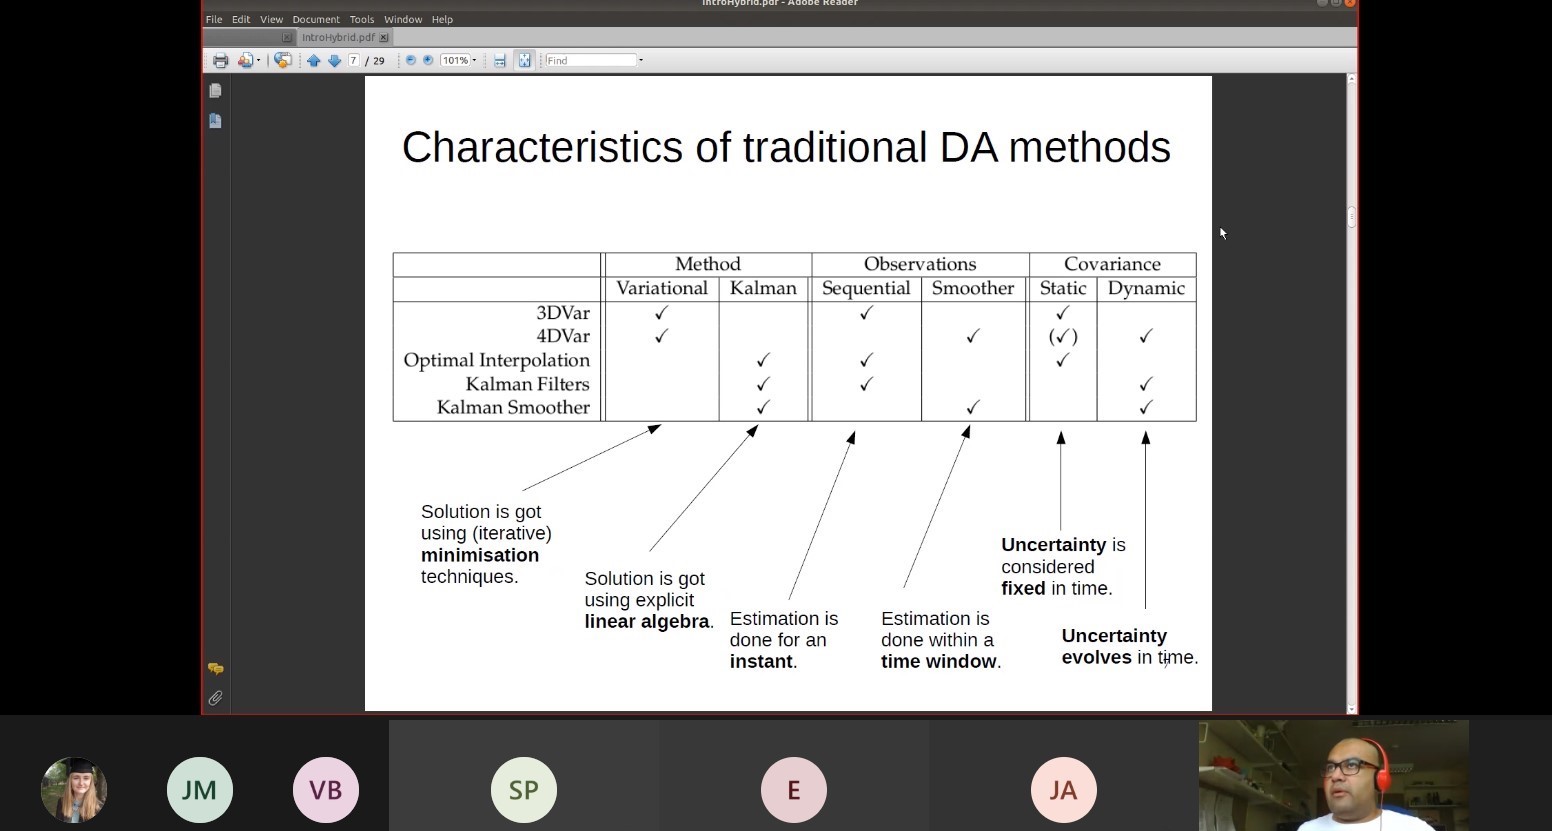
[Figure 1: Lecture by DARC scientist Dr Javier Amezcua]
So, how did we do it? By now we are already used to giving and listening to talks online, so the lecture part of the course was fairly straightforward. However, an important aspect of a course such as this is that it is interactive, with the possibility to ask questions. Thankfully the chat function worked well here, with participants putting questions in the chat continually and other DARC scientists responding if it wasn’t necessary to interrupt the lecture. Then computer practical exercises took place in breakout rooms, with groups of three participants working together. And during the breaks informal discussions took place using Gather.Town (a very impressive tool that I have only just discovered), including use of a virtual whiteboard to discuss further the mathematics. So what did the participants say about the online delivery? Comments included “I think the format worked really well”, “the arrangements for the remote delivery of the course were excellent”, “I think the practicals were organised well with lecturers rotating and coming to different rooms. That made me feel like I was in a classroom with having constant access to help”. Running this course certainly taught us a lot about how to teach data assimilation online, with lots of lessons learnt for the future. But everybody also realised that there are limitations to such a format. Hopefully next year we will be able to run the course in person again, with the opportunity for more informal discussions over coffee … and plenty of cake!
[Figure 2: Online group photo of some of the participants.]

References
Data Assimilation Research Centre (n.d.), What is data assimilation? https://research.reading.ac.uk/met-darc/aboutus/what-is-data-assimilation/
Data Assimilation Research Centre (2019). Online lecture notes from 2019 training course.
https://research.reading.ac.uk/met-darc/training/ecmwf2019/
Lawless, A.S. (2013), Variational data assimilation for very large environmental problems. In Large Scale Inverse Problems: Computational Methods and Applications in the Earth Sciences (2013), Eds. Cullen, M.J.P., Freitag, M. A., Kindermann, S., Scheichl, R., Radon Series on Computational and Applied Mathematics 13. De Gruyter, pp. 55-90.
Nichols, N.K. (2009), Mathematical concepts of data assimilation. Preprint MPS_2009-04. Department of Mathematics, University of Reading.
https://www.reading.ac.uk/maths-and-stats/-/media/project/uor-main/schools-departments/maths/documents/newdamaths-ch2-vmathsrpt-new.pdf?la=en&hash=E96FA6DB38B91F8EED56BF138634CCBD
