Simple but striking graphics showing how the world’s climate has changed, created by a Reading climate scientist, have reached millions worldwide, starting conversations that may lead to solutions.
Climate change affects every one of us – but it’s a complex issue to understand. Simple and compelling graphics developed by Reading climate scientist Professor Ed Hawkins have conveyed the scale of the problem in a simple way that can be understood instantly, by anyone.
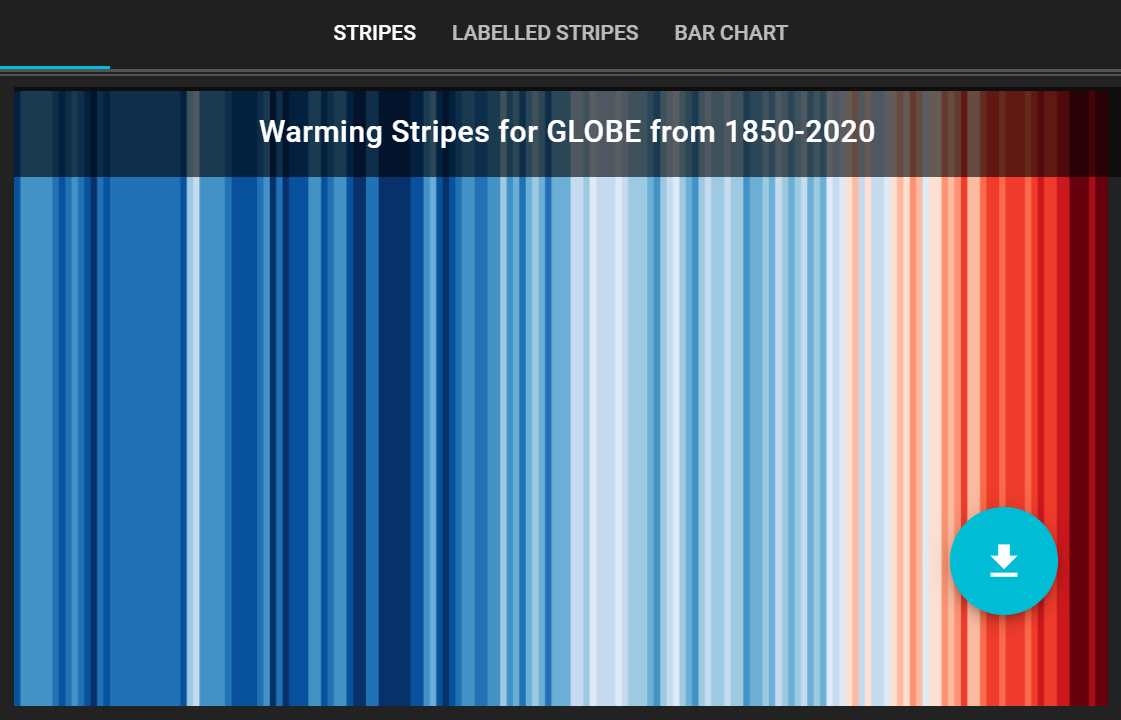
His two visualisations about how the climate has changed since the pre-industrial era – a spiral animation and ‘warming stripes’ visualising the average temperature each year as colours – are based on the best available quantitative climate observations and research. One shows temperature changes spiralling upwards. The other presents a snapshot of temperatures ramping up from cool blue hues in the 1850s to livid red in the present. Now widely recognised across the world, the graphics have appeared everywhere from the Olympic Games opening ceremony in Brazil, to US television weather presenters’ ties, to the Reading Music Festival, and across the BBC website during the COP26 climate negotiations.
For many, climate change might seem like a distant problem that only affects people far away. Professor Hawkins has intentionally made the graphics free and easy to download, use, adapt and personalise. His #ShowYourStripes website brings climate change to everyone’s doorstep by allowing people to download localised graphics showing how their home town has warmed over the past 170 years. In the first week alone, there were million downloads from 180,000 different visitors in over 150 countries. Everyday conversations about climate change are now happening as a result, opening up demand for more informed debate and action.
The Climate Spiral and Warming Stripes have found a place in the global public imagination and in doing so have become important symbols to get the world talking about climate change and how we respond to it.
Further reading
Partnering for the Planet website – Climate stripes
Climate Lab Book: Climate spirals
Press release: Award of Royal Society Kavli Medal for Climate Science Communication (2018)
View the full impact case study on the REF 2021 website: Communicating climate change through spirals and stripes visualisations and engaging a diverse global audience of millions