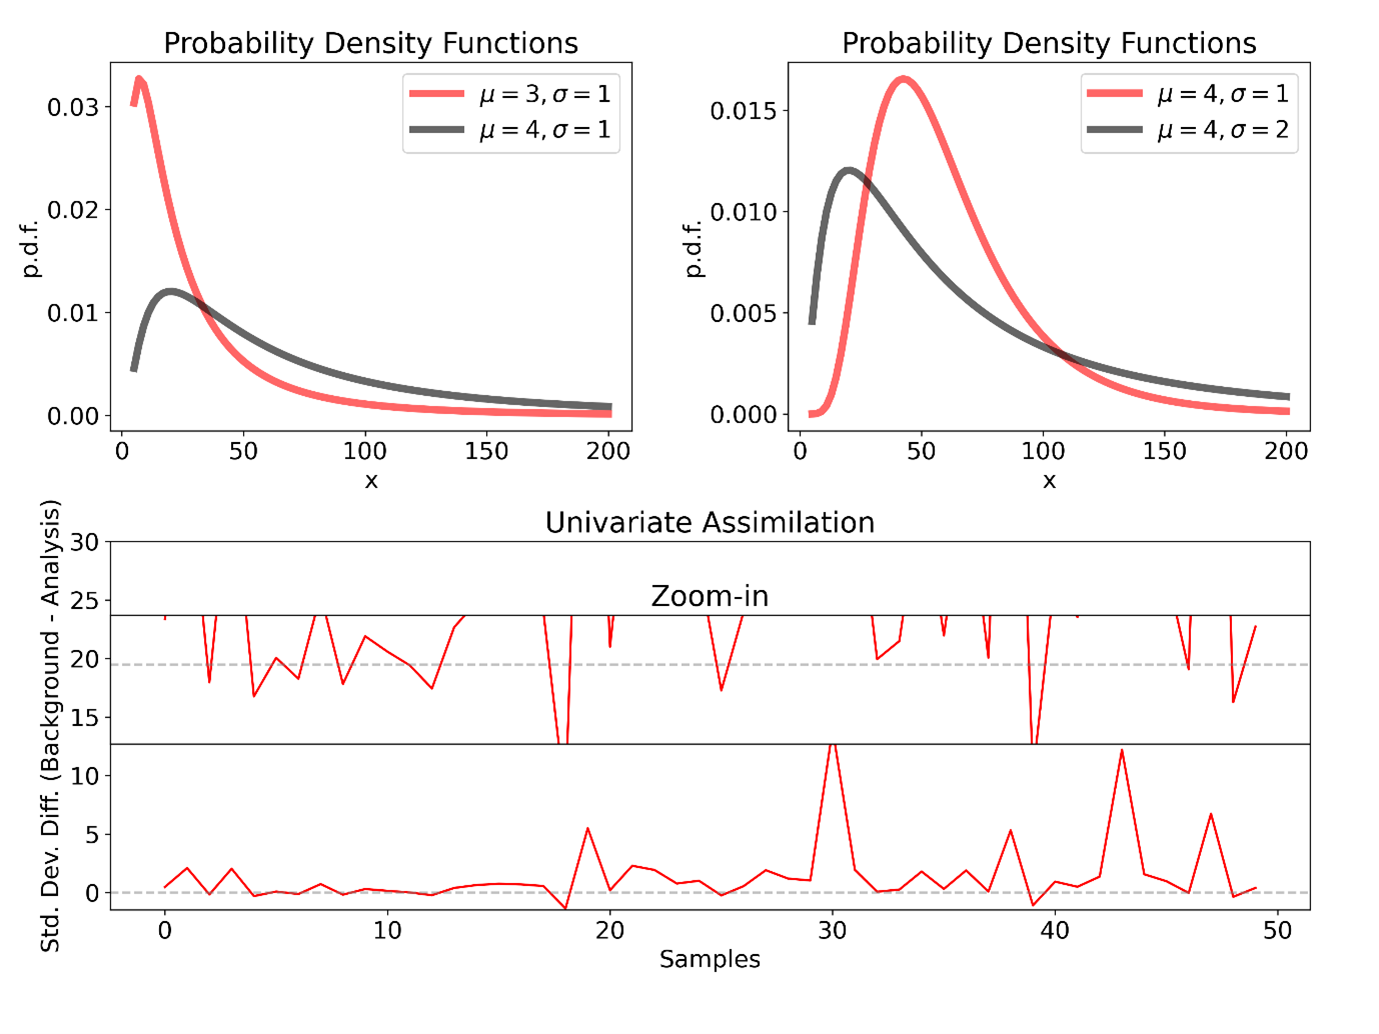
An illustration of log-normal distribution. Upper left: the probability density function of log-normal distribution with the same σ and different µ. Upper right: the same as upper left but with the same µ and different σ. Bottom: the difference of standard deviation between background and analysis from a univariate data assimilation experiment where background and observations are sampled from a normal distribution of a truth of 0 and σ = 1 and σ = 0.9, respectively. Here, for demonstration purpose, we only show the case that the observations are larger than the truth (i.e., biased observations). A negative difference means that the analysis variance is larger than the background.