Covid-19:
Using data assimilation to assess, monitor and predict a pandemic
We were part of a group of data assimilation scientists across several countries aimed at investigating the use of data assimilation to improve understanding and the prediction of the current Covid-19 pandemic. The project is led by Prof. Geir Evensen (NORCE and NERSC, Bergen, Norway).
We utilised an iterative ensemble smoother, the ensemble smoother with multiple data assimilation (ESMDA), to estimate parameters of a SEIR model with age-classes and compartments of sick, hospitalised, and dead. The data conditioned on are the daily numbers of accumulated deaths and the number of hospitalised. It is also possible to assimilate the number of positive cases obtained from testing, but this is usually a large underestimate due to limited testing capabilities. However, using the analysis of the number of infected that is consistent with the data for fatalities and hospitalised, we can estimate the percentage of infected that are officially reported (see Fig. 3 below).
The updated ensemble of model simulations has predictive capabilities and includes uncertainty estimates. In particular, we estimate the effective reproductive number as a function of time, and we can assess the impact of different intervention measures. Moreover, from the updated set of model parameters, we can make accurate short-term predictions of the epidemic development given knowledge of the future effective reproductive number, but also long-term scenarios of the epidemic under different assumptions.
We have applied the model system on data sets from Norway, England, France, the Netherlands, Argentina, Brazil, Quebec of Canada and four states (New York, Alabama, California and North Carolina) of the USA. Their diverse geographical locations, including seasonal phase opposition, demography, population densities, and social habits, led the epidemic to evolve in different ways and to impact differently on their very distinct health care systems.
Full details of the method and results can be found in this manuscript.
A departmental blog on this work was published on 22 June 2020 and a University press release on 1 July 2020.
This webpage was dedicated to providing weekly updates to our estimates and predictions for England.
We only provide predictions for England due to the difficulty in collecting consistent data across the different nations of the UK and the different interventions that have been imposed.
Data sources
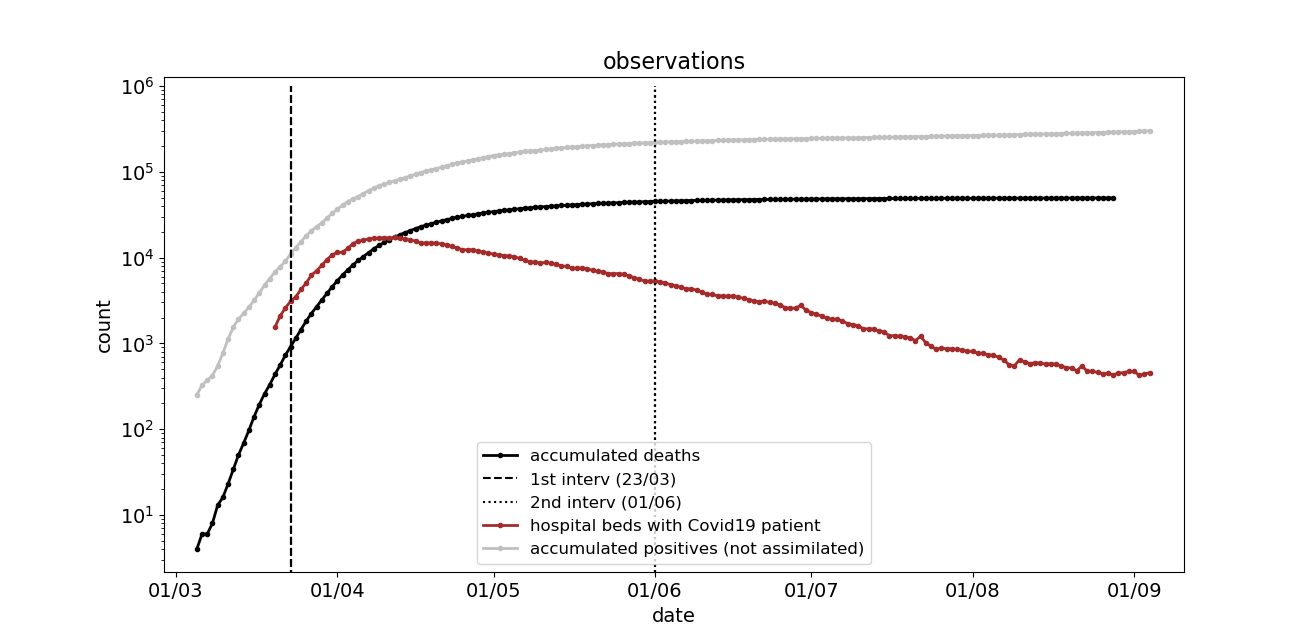
- Data for number of suspected Deaths due to covid-19 were published by ONS every Tuesday.
- Data for number in hospital with covid-19 were provided by the daily governmental press conferences.
- Data on the number of positive cases were provided by PHE.
Results (updated 8th September 2020)
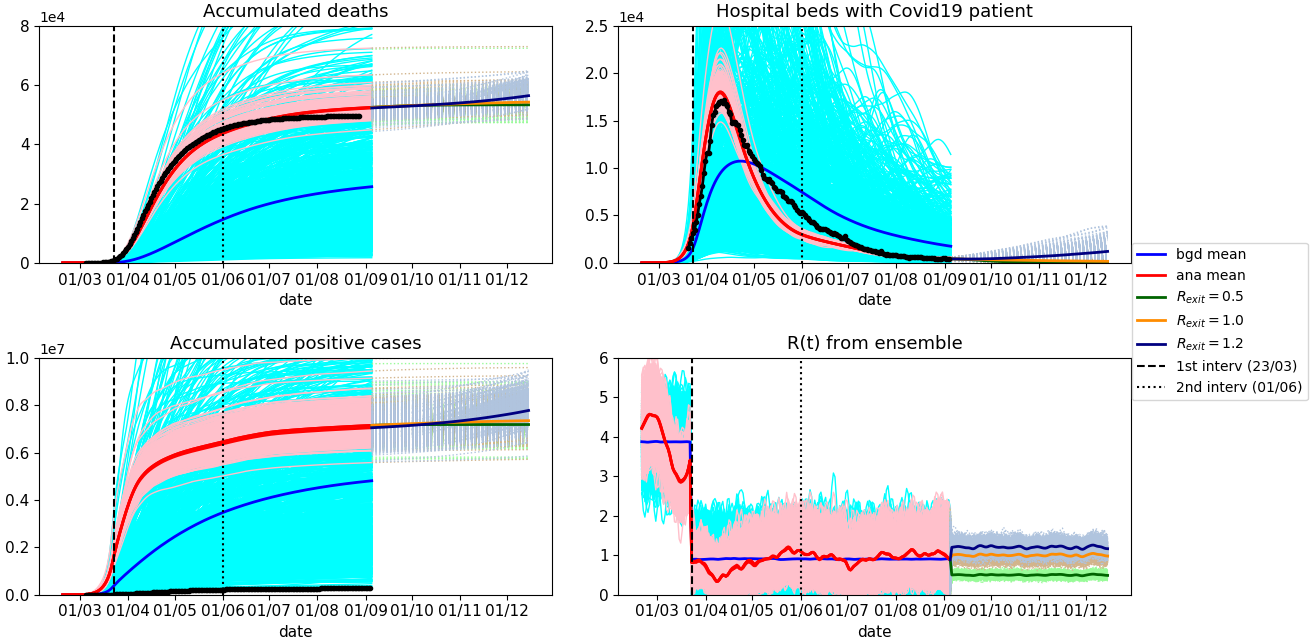
Figure 2 shows the ESMDA prior (bgd in the legend) and posterior (ana in the legend) estimates of the accumulated number of deaths, daily number of hospitalisations, total cumulated cases and the effective reproduction number R(t). Observations are displayed in black. For the sake of clarity background ensemble is shown for the effective R(t) only.
Vertical dashed lines indicate the beginning of the lockdown in UK (March 23rd) and the release of it on June 1st. The model uses different contact matrices to reflect the different social behaviour, and thus potential transmission among age classes, during and before/after lockdown. Note how effectively the ESDMA is able to track the start of the lockdown leading to a decrease of R(t).
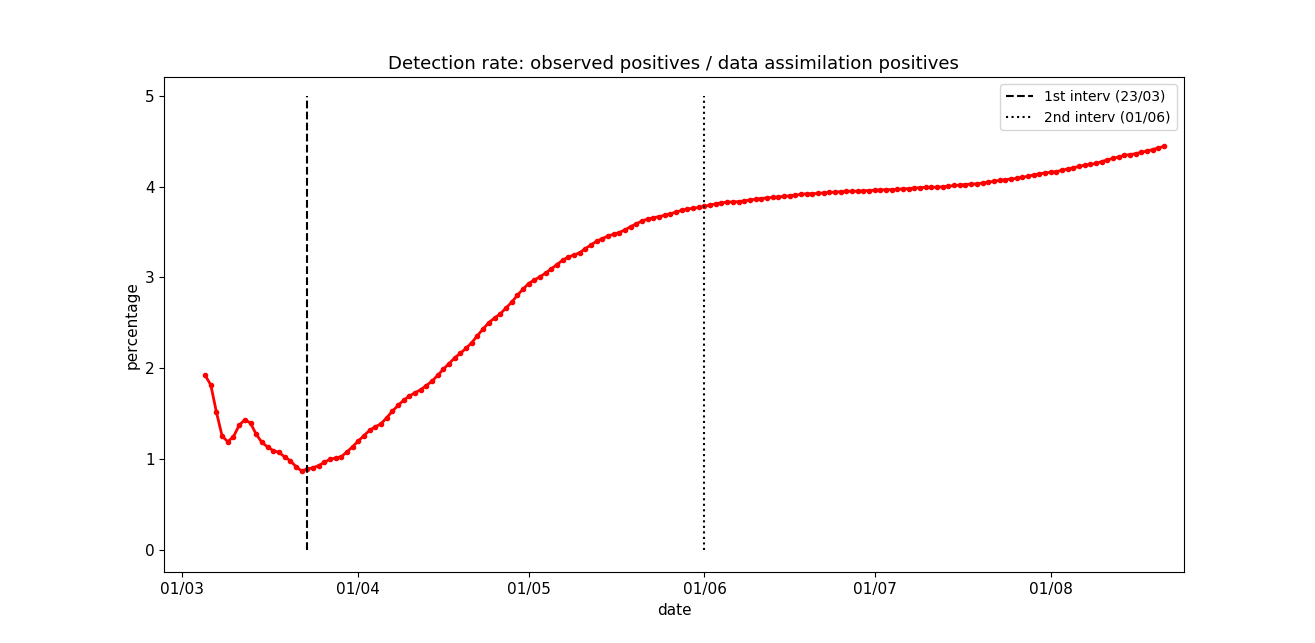
The analysis of positive cases tells us the number of infected that is consistent with the observed deaths and numbers in the hospital. From this, we can estimate the percentage of actual positive cases reported. Figure 3 shows that after the first of June close to 4% of the actual number of infected people have been detected with the current testing in England. This estimated percentage of reported cases can be compared to the percentage of asymptomatic cases. WHO suggests that 80% of infections are mild or asymptomatic. Therefore, due to the testing strategy in the UK (only testing people displaying symptoms), we could conclude that about 20% of the accumulated symptomatic cases are being reported from the beginning of June.
Predictions out to 1st December
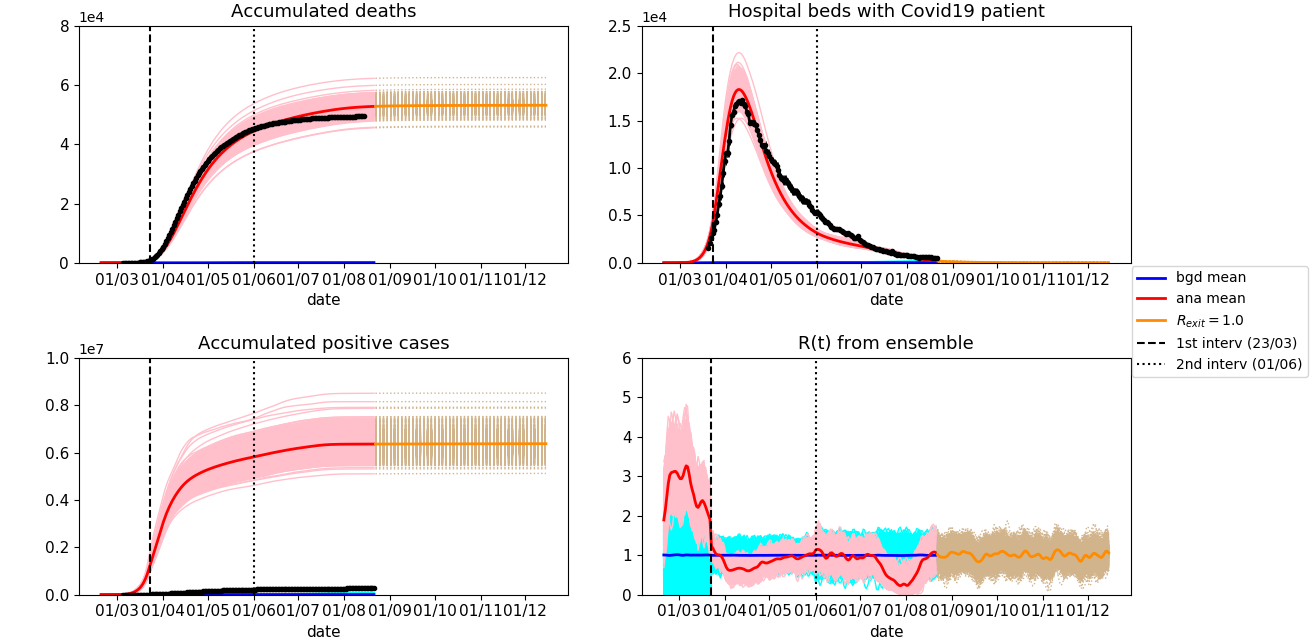
In a separate experiment, we have explicitly imposed the dates for the beginning and relaxation of the lockdown on the prior value of R. These results are shown in Figure 4. After the data period, we run predictions under three different epidemic scenarios with the prior reproduction numbers R = 0.5, 1.0, and 1.2. To the neutral, R = 1.0, scenario, we added a pessimistic one, R = 1.2, representing a situation without effective epidemic countermeasures, and an optimistic one, R = 0.5, in which effective mitigation measures are in order.
As of 1st August, approximately 50,000 deaths were attributed to Covid-19 in England in all settings (source, ONS). Our projections under the three different scenarios predict that by the 1st December, the total deaths will be 53,300±1,500 (R=0.5), 54,000±1,400 (R=1) and 55,500±2,6400 (R=1.2).