Cohort 7 student Helen Hooker brings research into practice during a placement with JBA Consulting
In August 2022, devastating, widespread flooding in Pakistan displaced 33 million people. The Pakistan floods have highlighted the importance of earth observation (EO) data for observing flooding extent. Figure 1 shows an estimated flood inundation area of 30% of the country. These flood maps give vital information to emergency response teams and aid operations. They also benefit flood forecasting agencies, who often use hydrometeorological models to predict the evolution of flooding extent. Flood forecasters can use observed flood maps derived from EO data to evaluate how well a forecasting system is performing and improve their predictions about how the flooding may evolve over time. EO data are particularly valuable over large areas where ground-based observations are limited or where they are destroyed during a flood.

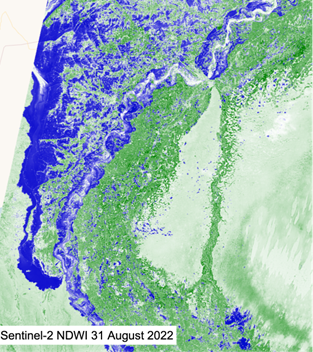
Figure 1: Observed flooding from Optical (Sentinel-2) and SAR (Sentinel-1) satellite data. Source ESA.
Optical images from Sentinel-2 satellite data can be used to determine the flood extent by calculating the Normalised Difference Water Index (NDWI). Unfortunately, optical instruments need daylight and cannot see through cloud. Synthetic Aperture Radar (SAR) sensors can detect flooding through cloud and at night, which means they are very useful for monitoring flood situations.
Comparing forecast flood maps against observed, EO-derived flood maps forms an important part of evaluating and improving model performance. For quantitative validation, skill scores can be calculated for an area of interest. The skill scores work by comparing each grid box or pixel in the modelled flood map with the corresponding satellite image, and by applying a contingency table an overall measure of accuracy can be calculated.
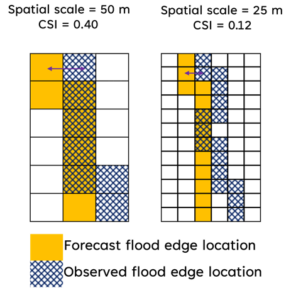
Figure 2: Impact of grid size or spatial scale on binary skill scores.
These scores will vary depending on the size of the flood, the size of the model grid box (spatial scale) and the accuracy of the flood map. Figure 2 demonstrates how a smaller spatial scale affects a commonly applied skill score (CSI or Threat Score). Where the forecast flood edge misses by one grid box (see purple arrow), whilst the 25 m flood map is closer in terms of distance, the overall CSI value is much lower. This can make interpreting the skill score difficult, particularly when it is calculated as an average score across a region.
To overcome these issues, we have recently published a paper where we suggested validating the flood map using a scale-selective approach. This means computing a skilful scale (grid box size) rather than a skill score. The skilful scale can also be calculated for the flood edge location. This can then be interpreted as the average physical distance between the edge of the flooded area observed in the EO map and the edge in the modelled flood map. We can also calculate a skilful scale at each location across the area to show locally how the flood map performs. The skilful scales can be plotted on a Categorical Scale Map (CSM), which colour-codes each location according to the degree of under- or over-prediction as explained below.
During a placement with JBA Consulting, these evaluation methods have been applied to a project with Start Network to establish Disaster Risk Financing schemes in northern Bangladesh. Figure 3 shows an example CSM. Correctly predicted flooding is shown in grey, under-prediction or ‘miss’ areas are red and over-prediction or ‘false alarm’ areas are blue. The shading relates to the skilful scale calculated for each grid cell. Lighter shades show a smaller skilful scale and a closer agreement. This evaluation led to updates in the Flood Foresight system which improved the agreement between the forecast flood maps and the EO flood maps. This improvement means that the population impacted by flooding can be more accurately predicted for future flood events.
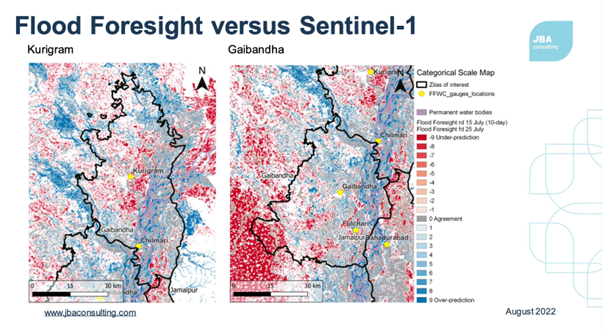
Figure 3: Categorical Scale Maps (CSM) for Flood Foresight predictions of flood extent compared to EO observed flood extent, Bangladesh July 2020.
In summary, the CSMs give additional benefits to conventional binary performance measures as they show a quantitative, location specific measure of flood map accuracy that can be used to target specific model improvements such as updating the DTM or improving model parameters used to produce the flood map. The work placement was a great opportunity to see the impact of our research on real world challenges.
Contact
Helen Hooker, University of Reading: h.hooker@pgr.reading.ac.uk
Rob Lamb, JBA Trust: rob.lamb@jbatrust.org
John Bevington, JBA Consulting: john.bevington@jbaconsulting.com
References
Gao, B. (1996). NDWI—A normalized difference water index for remote sensing of vegetation liquid water from space. Remote Sensing of Environment, 58(3), 257–266. https://doi.org/https://doi.org/10.1016/S0034-4257(96)00067-3
Hooker, H., Dance, S. L., Mason, D. C., Bevington, J., & Shelton, K. (2022). Spatial scale evaluation of forecast flood inundation maps. Journal of Hydrology, 128170. https://doi.org/https://doi.org/10.1016/j.jhydrol.2022.128170
Hooker, H., Dance, S. L., Mason, D. C., Bevington, J., & Shelton, K. (2022). A new skill score for ensemble flood maps: assessing spatial spread-skill with remote sensing observations. Natural Hazards and Earth System Sciences Discussions, 2022, 1–27. https://doi.org/10.5194/nhess-2022-188