Microwave FCDR Case Study
By Martin Burgdorf
This is the account of generating the Microwave FCDR. For a more detailed description see Hans et al. (2019a).
Introduction
The FCDR from FIDUCEO contains the brightness temperature measured by the microwave humidity sounders Special Sensor Microwave Water Vapor Profiler (SSMT-2), Advanced Microwave Sounding Unit-B (AMSU-B) and Microwave Humidity Sounder (MHS) on polar orbiting satellites. As these datasets now cover more than 20 years, and water vapor is the most important greenhouse gas, they become increasingly relevant for climate science. Another application of the new FCDR is the assimilation into re-analyses.
The available operational data of these microwave humidity sounders exhibit certain problems that prevent the application of the data for climate monitoring thus far:
- Overlaps of subsequent orbit files create artefacts that need to be filtered out by the users.
- Uncertainty information is lacking completely for some instruments, for others it is limited to the noise equivalent differential temperature.
- The presence of very strong, time dependent, increasing biases of several kelvin for certain instruments.
There were various efforts in the past to deal with the inconsistencies between different instruments. This was usually done by fitting a polynomial of order one to the bias as a function of scene temperature for each channel of each instrument in every month of operations. This kind of bias correction, however, is an ad hoc solution without consideration of the underlying instrumental effects causing the biases.
Our approach for the AMSU-B and MHS sensors is to analyze the biases and to understand their origin in order to mitigate their effect by a recalibration procedure, leading to a consistent FCDR. This recalibration is based on a metrology inspired measurement equation approach, see Mittaz et al. (2019).
Data Processing
The three instruments mentioned above are very similar in their scanning mode, calibration procedure and spectral characteristics. The instruments have five spectral channels, three of which are sounding channels sensitive to water vapor absorption at different altitudes. Two further channels detect radiation from deeper layers of the atmosphere and from the surface. Table 1 summarizes key characteristics of the instruments. The most interesting channel in terms of the upper tropospheric humidity (UTH) is the channel at 183 ± 1 GHz, closely positioned around the strong water vapor absorption line.
Table 1. The basic instrumental characteristics of SSMT-2, AMSU-B and MHS.
|
Instrument/Antenna package
|
SSM-T2
|
AMSU-B
|
MHS
|
|
Channel frequencies (bandwidths) (GHz)
|
91.655±1.25 (3)
150.0±1.25 (1.5) 183.31±1.00 (1.5) 183.31±3.00 (1) 183.31±7.00 (0.5) |
89.0±0.9 (1)
150.0±0.9 (1) 183.31±1.00 (0.5) 183.31±3.00 (1)183.31±7.00 (2) |
89.0 (2.8)
157.0 (2.8) 183.311±1.0 (1) 183.311±3.0 (2) 190.311 (2) |
|
Number of warm target PRTs
|
2
|
7
|
5
|
|
Satellites (utilization period covered by FCDR)
|
DMSP-F11
(Jul 94– Apr 95) DMSP-F12 (Oct 94–Jan 01) DMSP-F14 (Apr97– Jan 05) DMSP-F15 (Jan 00–Jan 05) |
NOAA-15
(Jan 99 – Mar 11) NOAA-16 (Mar 01 – Apr 14) NOAA-17 (Oct 02 – Apr 13) |
NOAA-18
(Aug 05 – Dec 17) NOAA-19 (Nov 09 – Dec 17) Metop-A (Jun 07 – Dec 17) Metop-B (Jan 13 – Dec 17) |
|
Pre-Launch NEDT (K)
|
0.6 – 0.8
|
0.37 – 1.06
|
0.22 – 0.51
|
|
Beam width (degrees)
|
6.0 at 91.655 GHz
3.7 at 150 GHz 3.3 at all other channels |
1.1
|
1.1
|
|
Scan range (degrees)
|
±40.5
|
±48.95
|
±49.44
|
The data processing started with uncalibrated level 1b data from the NOAA CLASS (Comprehensive Large Array-data Stewardship System) archive, covering the missions of the eleven individual instruments. From the level 1b files, all information and data necessary for recalibration are read in our new processing chain.
The main problems with earlier processing of the operational data as listed in the introduction were addressed in the following way:
- Each file of the FCDR files contains a single orbit from one equator crossing in a chosen flight direction to the next crossing in the same direction. This equator-to-equator frame makes the files ready-to-use, since it removes the overlap of subsequent orbits.
- A key aspect of the new FCDR is the extensive information on uncertainty of the measured brightness temperature. To obtain this uncertainty information, all sources of error in the measurement process need to be assessed, and the associated uncertainties need to be estimated and propagated to brightness temperature. These sources were classified as independent, structured or common, depending on the correlation scale of the underlying error.
- Independent effects are random and have no correlation between different pixels, e. g. the scatter of Earth view counts.
- Common effects are systematic and affect all calculated brightness temperatures the same way, e. g. a poorly calibrated temperature sensor on the black body.
- Structured sources of uncertainty are random in nature, but introduce correlations between pixels and a few scan lines, e. g. the scatter of space view counts, which are used for calibrating several consecutive scans.
- A careful analysis of the calibration method revealed several aspects that required improvement.
- The antenna pattern correction (APC), i. e. the removal of contamination entering through the side lobes, was revised for all sounding channels of AMSU-B and for MHS on NOAA-18.
- Radio Frequency Interference (RFI) was identified as a major cause for anomalies in the Earth scene counts from certain channels of AMSU-B on NOAA-16 and MHS on NOAA-19. Its effect was removed with a new type of correction scheme, see Hans et al. (2019b).
- Minor corrections applied:
- Improved band correction for black body and deep space view
- Making full use ofplatinum resistance thermometers of the black body
- More accurate value for the temperature of the cosmic microwave background
The complete understanding of all effects relevant to the measurement equation, which is used to turn counts into brightness temperatures of the Earth scenes, made it possible to calculate realistic estimates for the systematic uncertainties of the FCDR.
FCDR Example Contents
The FIDUCEO FCDR is a ready-to-use dataset providing the data of eleven missions of microwave humidity sounders stored in orbital chunks in NetCDF-4 files. In total, the record has a size of 2.2 TB, with 6.8 MB (AMSU-B and MHS) or 0.6 MB (SSMT-2) per file. Each file contains a single orbit from one equator crossing in a chosen flight direction to the next crossing in the same direction.
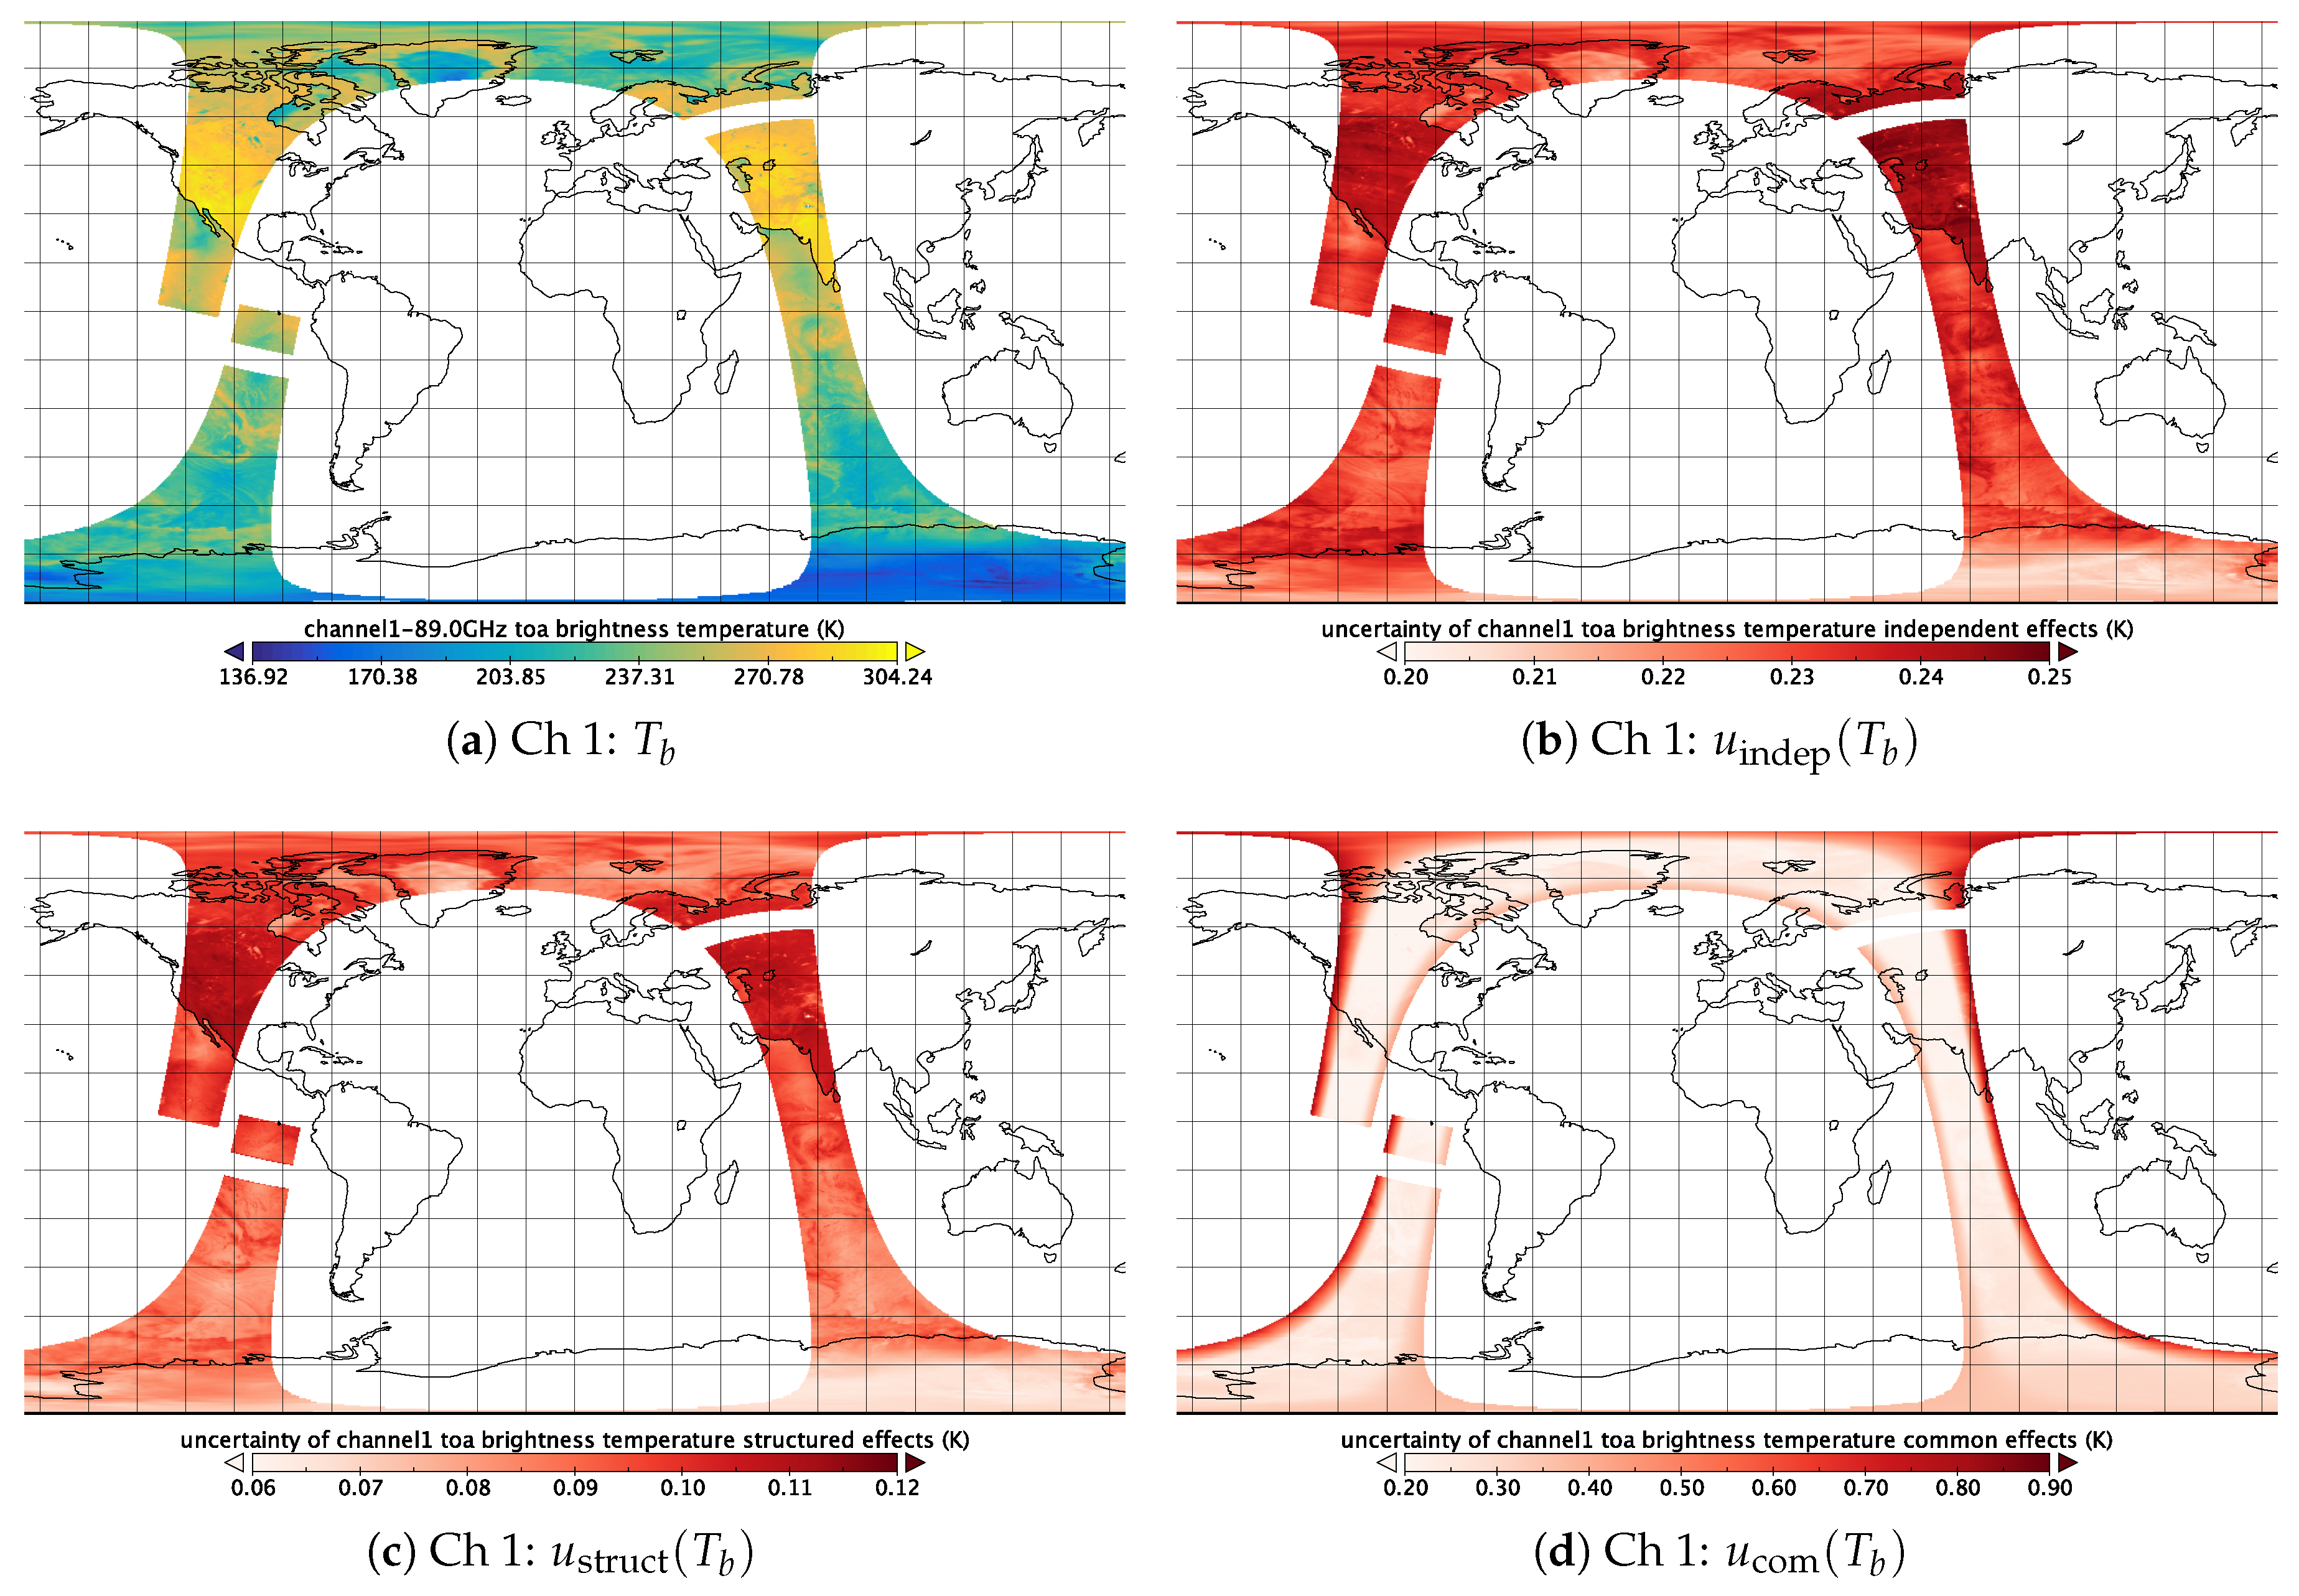
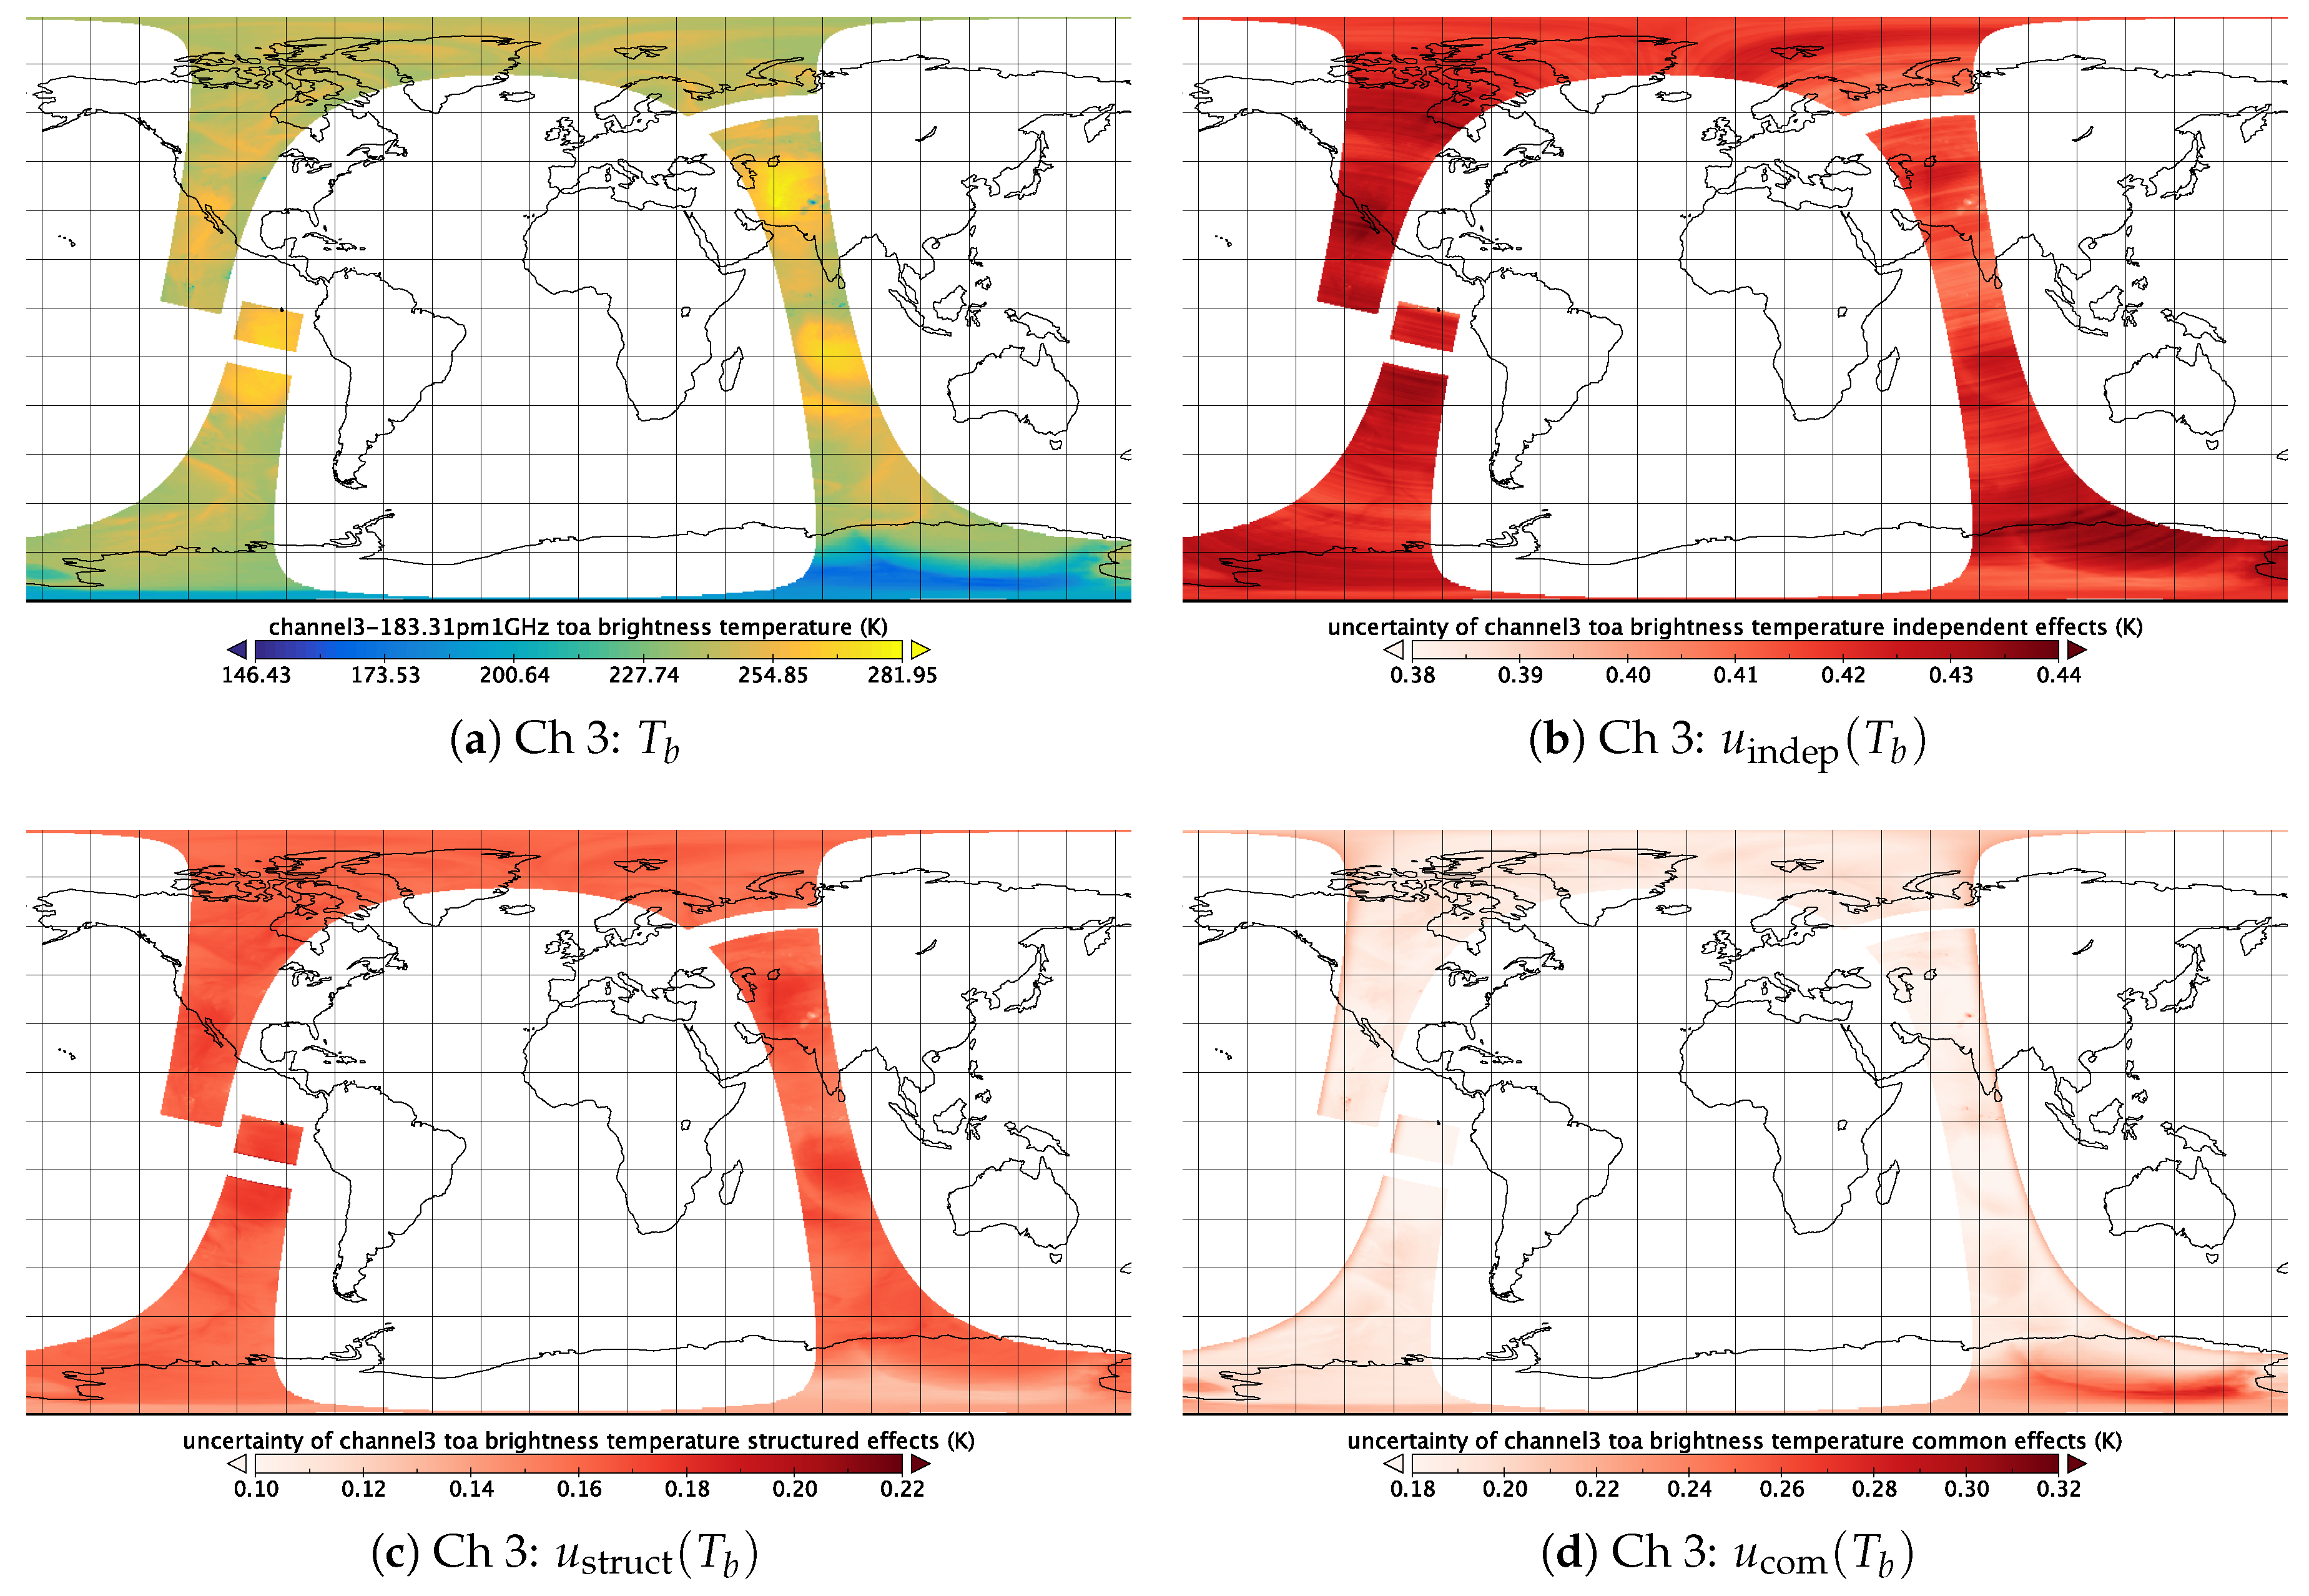
Figures 1 and 2 show the brightness temperature and its uncertainty for channel 1 and 3 of the example orbit of MHS on Metop-B (start: 6 July 2015 15:47:58, end: 6 July 2015 17:29:18). Note the equator-to-equator frame. The two data gaps seen in this orbit are explained by the quality flags. The quality flags are set during our FCDR processing and provide general information on the quality of the pixels and also on channel-specific issues. The first data gap close to South America is due to missing data. The second data gap is due to a Moon intrusion in the DSVs, which spoils the signal from the cosmic microwave background used as calibration reference. Note also the different ranges and distribution patterns for the uncertainty classes.

Figure 1. Channel 1: Brightness temperature and its uncertainties (Hans et al., 2019a).

Figure 2. Channel 3: Brightness temperature and its uncertainties (Hans et al., 2019a).
Improvements in the FCDR
Applying the improvements listed above to the FCDR processing, we obtained a new FCDR that is more user-friendly, for the tedious handling to remove artefacts due to doubled data is not necessary.
The obtained uncertainties stored in the FCDR appear reasonable, although it should be noted that some of them are merely based on estimates of the uncertainties on the input calibration parameters. These estimates may be rough, but they still provide an impression of the final uncertainty of the brightness temperature that users have to expect.
|
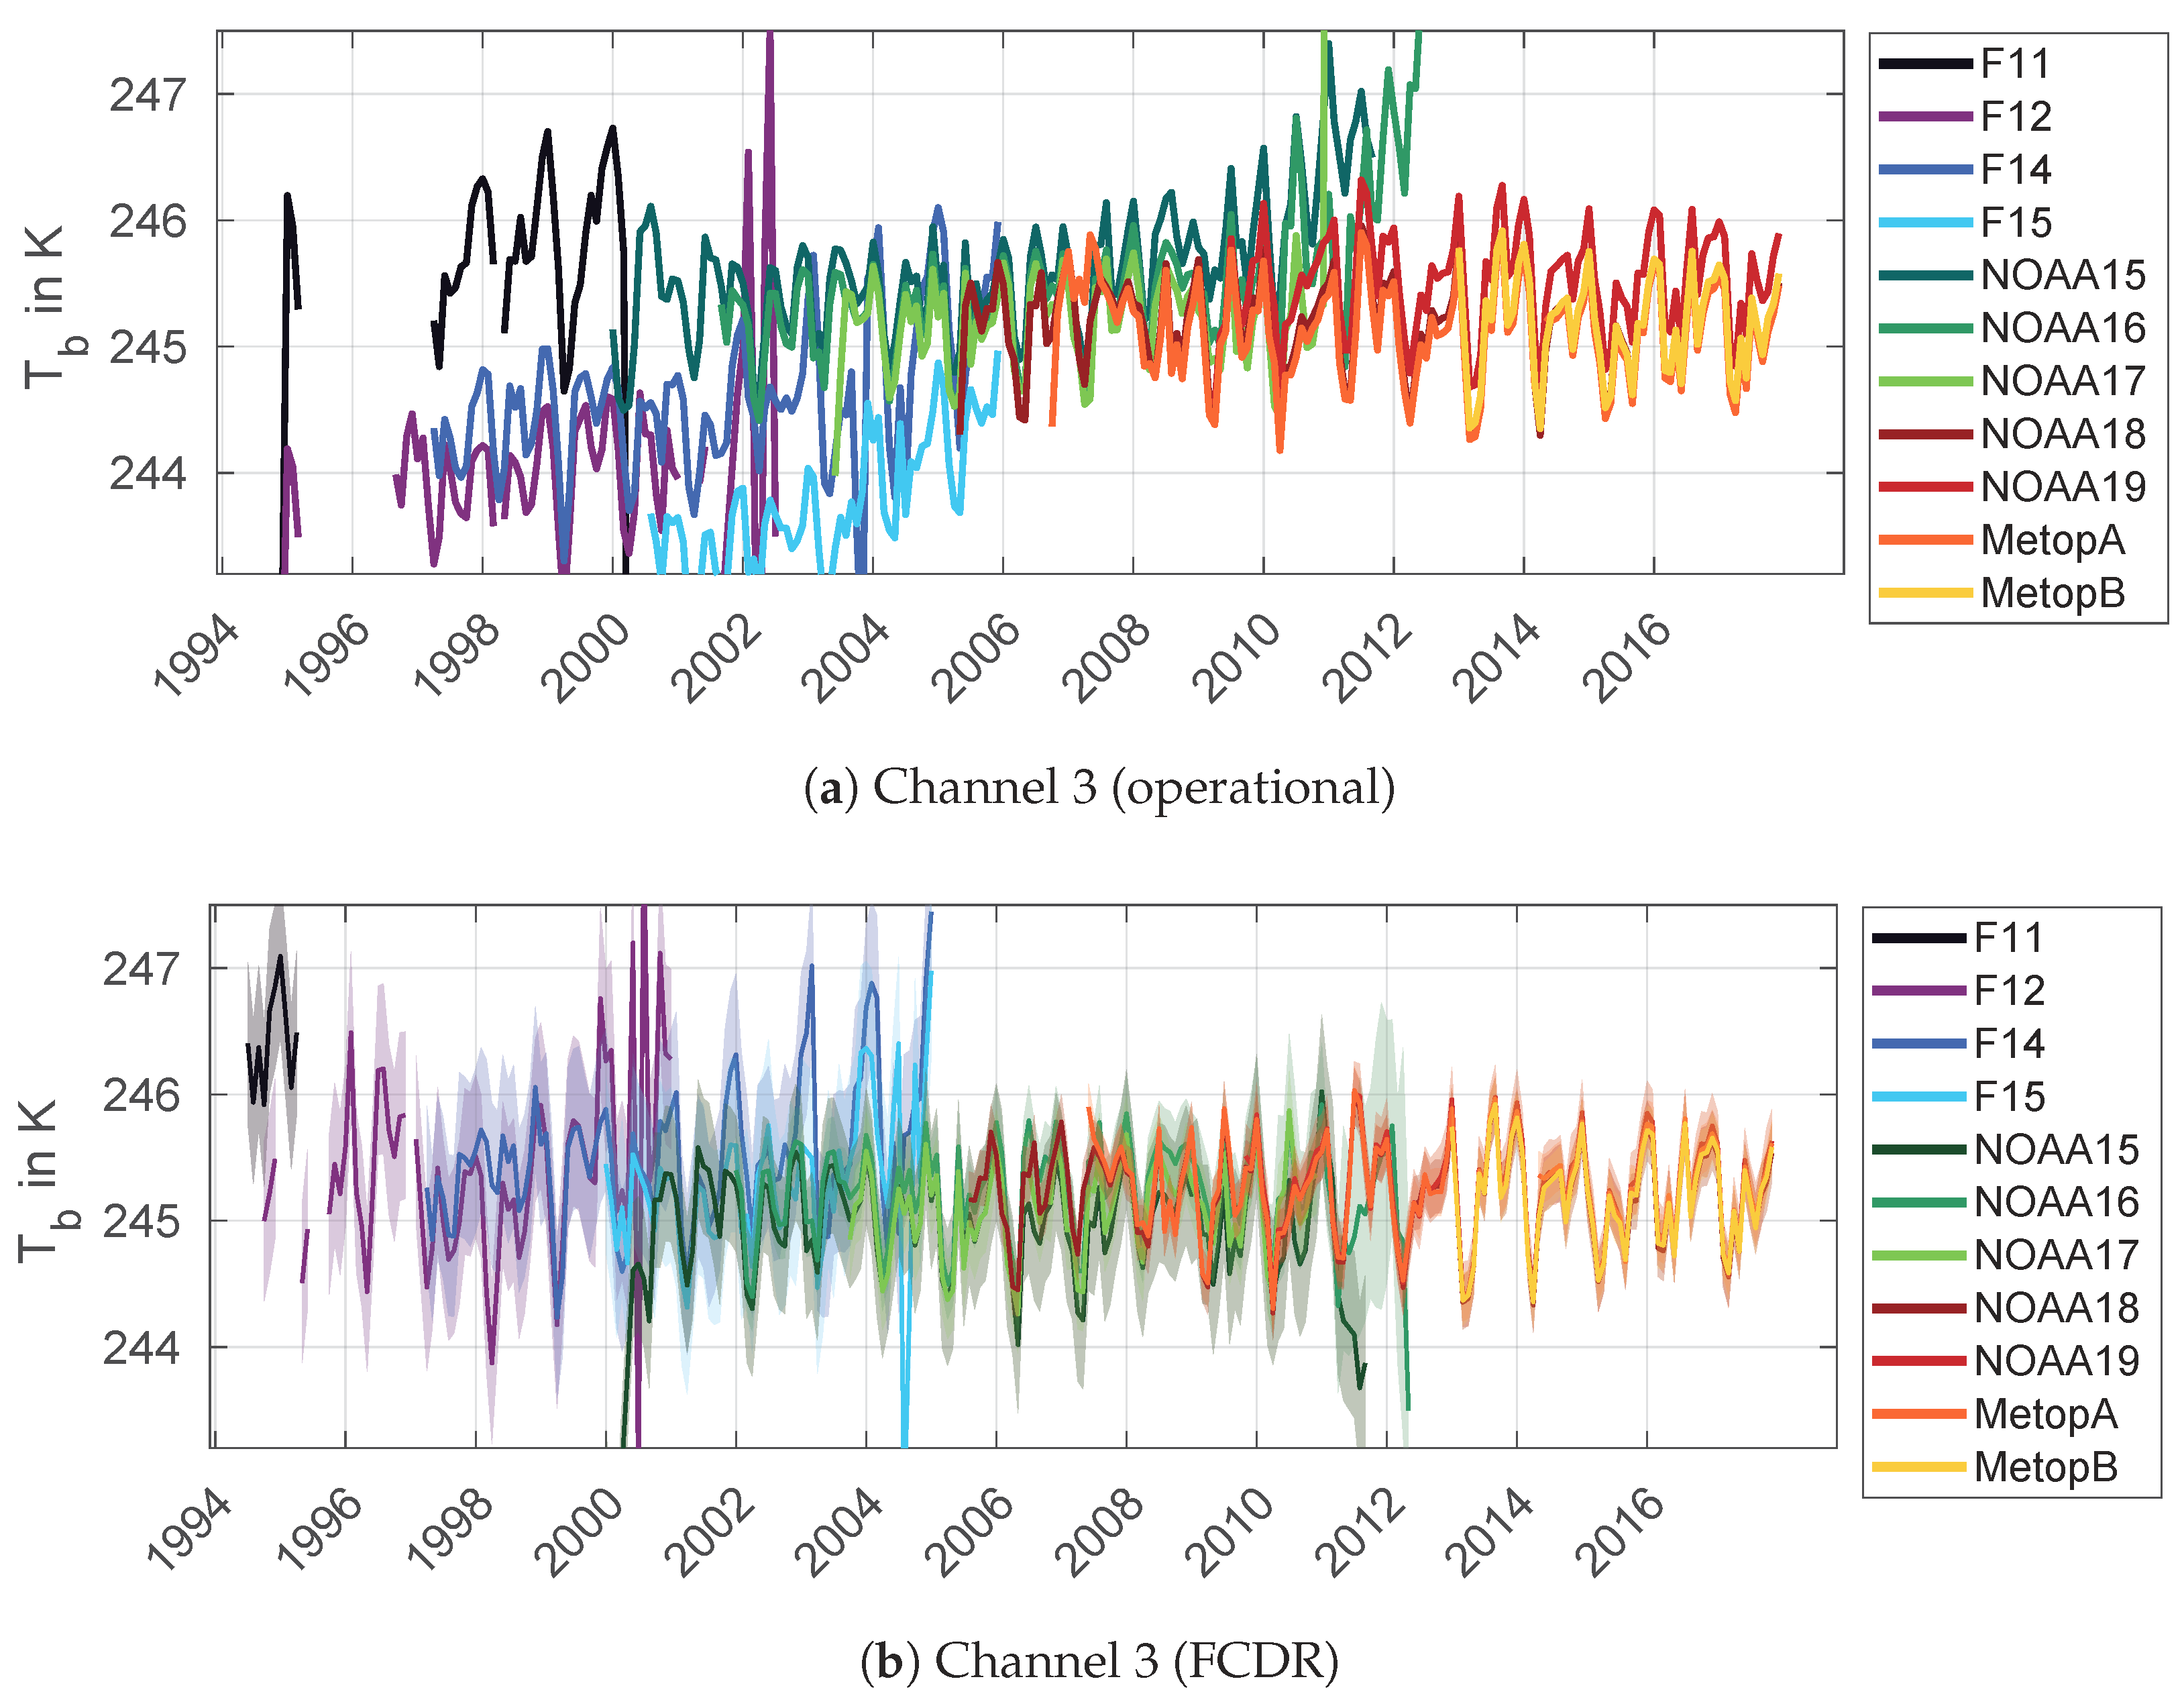
Overall, the applied improvements in the parameters of the measurement equation and the correction for RFI contamination have increased the inter-satellite consistency. This is demonstrated in Figure 3.
|

Figure 3. Comparing the time series of brightness temperature in channel 3 for all MW instruments in (a) operational data (NGDC for SSMT-2 and AAPP processed data for AMSU-B and MHS) and (b) FCDR data as function of time. The FCDR provides more consistent and stable time series due to improved calibration. For the FCDR, the shaded regions denote the uncertainty due to common effects. There is no corresponding uncertainty estimate on the operational data (Hans et al., 2019a).