Link to the CEOS Cal/Val portal where these tutorials:http://www.fiduceo.eu/tutorial/introduction, http://www.fiduceo.eu/tutorial/what-are-effects will eventually live
What is uncertainty analysis?
Uncertainty analysis presumes that the result of a measurement has been corrected for all recognized systematic effects, and that every effort has been made to identify such effects. This means that the measurand will be as accurate as possible given the current state of knowledge. When we perform analyses at the effects level we need to decide whether the effect could be fully, or partially corrected for, and if so we should apply the correction. The residual uncertainty after correction is smaller. Performing uncertainty analysis therefore often has the co-benefit of improving EO data.
How do you analyse uncertainties?
FIDUCEO uncertainty analysis starts with the measurement equation. Each term in the measurement function is one of the following:
- Directly measured/observed/output in the sensor – in this case consider sources of uncertainty in this measurement. How can you estimate the noise? Is the signal or the noise associated with it sensitive to any conditions (e.g. temperature)?
- Evaluated from its own measurement function – calculated from other more fundamental observations and calibration parameters; what is that equation?
- A calibration parameter that was determined – should this be best determined prelaunch, in flight or through harmonisation? What was the process by which it was determined? What were the uncertainties associated with that determination?
- A constant – is this a true constant (e.g. the speed of light) or an assumed constant (e.g. an assumed emissivity of an onboard blackbody)? If the latter, are there ways of estimating uncertainty? Could this be made a variable to be determined through harmonisation?
- The Plus Zero term – always include a Plus Zero term, not only in the main measurement function, but also in subfunctions. What assumptions are there in the form of the equation? What is the uncertainty associated with those assumptions? (Things to consider: are you approximating an integral with a single value or a summation? Are you ignoring higher order terms? Are you assuming something cancels out?)
At this stage we need to identify all the sources of uncertainty associated with each term in the measurement function, and, where that leads to a new measurement function, to those terms within that.
For more details see Section 3.3.2 (“How deep should we go?”) in Woolliams, E., Mittaz, J., Merchant C. & Harris, P., 2017, D2_2a Principles of FCDR Effects Tables
How do you define an uncertainty tree?
The uncertainty analysis we describe here is centred on the measurement function for calibrated radiances, the data of L1 products. Typically, some input quantities are directly determined (by measurement, parameterisation or data analysis), while others are determined through their own measurement function of other input quantities. Thus, there can be a hierarchical aspect to uncertainty analysis. To help organise a measurement-function centred analysis of uncertainty, it can be useful to prepare a graphical representation in the form of an uncertainty analysis diagram. Uncertainty analysis starts at the terminations of the uncertainty analysis diagram and propagates uncertainty through each measurement function, in sequence through the hierarchy as necessary.
The uncertainty tree diagram shows, schematically, the uncertainties associated with the terms in the measurement function. In the centre there is the measurement function, and from each term, there are links either to another measurement function (as in the x_{2} case in the diagram below) or to a single (x_{3} )or multiple sources of uncertainty (x_{1} ). Where there is a link to a source of uncertainty, this is through a sensitivity coefficient (the partial derivatives).
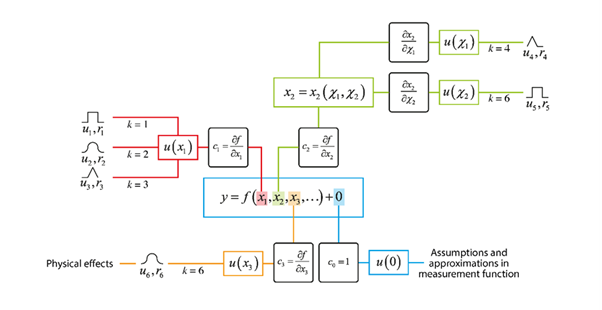
The figure above shows the uncertainty analysis diagram – this is the hypothetical case for a measurement function
=f(x_{1},x_{2},x_{3},…)+0
where the x_{i} input quantities are metrologically independent (have no common error). There are three identified effects that cause uncertainty in the first measurement function term,
x_{1}. The contribution to uncertainty and error correlation (from spectral band to spectral band and/or from image pixel to image pixel) properties for each of these effects have been evaluated, an encapsulated in a quantitative model for each effect, these models being indicated symbolically by u_{1}, r_{1}, etc. The uncertainty in x_{1} propagates to the measurand via the sensitivity coefficient c_{1}. The second term is itself the result of an explicitly-calculated measurement function, meaning that the analysis is hierarchical. Two effects operating on different terms cause uncertainty in x_{2}. The propagation of uncertainty
u(\chi_{1}), for example, to the measurand is via a sensitivity obtained by the chain-rule of sensitivity coefficients along the connecting branches:
∂f ∂x 2∂x 2∂\chi_{1}
Three identifiable physical effects contribute to the uncertainty u(x_{1}) u(x3), but these cannot be separately quantified. Instead, they are jointly evaluated in terms of their combined uncertainty and error correlation properties, and treated in calculation of propagated uncertainty as the single effect k=6.
Lastly, u(0),represents the fact that the form of the measurement function itself embodies assumptions and approximations that cause uncertainty in the measurand that should be evaluated.
How do you draw an uncertainty tree?
To draw the uncertainty tree:
- Put the measurement function in the middle
- Where possible use different colours for different branches (unless you want to emphasise the similarities between two branches)
- Use horizontal and vertical lines and right angles
- Put the sensitivity coefficients in black rounded rectangles and the sources of uncertainty in coloured straight rectangles. Write the sources of uncertainty on the lines at the end.
There is always a point where you don’t think a particular source of uncertainty is significant or not, or whether you perhaps don’t know how to quantify a particular uncertainty. It’s better to put it on the diagram and explain that in the text around the diagram, than to leave it off the diagram.
Useful documents
Woolliams, E., Mittaz, J., Merchant C. & Harris, P., 2017, D2_2a Principles of FCDR Effects Tables
JCGM, 100:2008, Evaluation of measurement data – Guide to the expression of uncertainty in measurement