The Sea and Land Surface Temperature Radiometer – high quality surface temperatures from space
Posted on
by David Moore
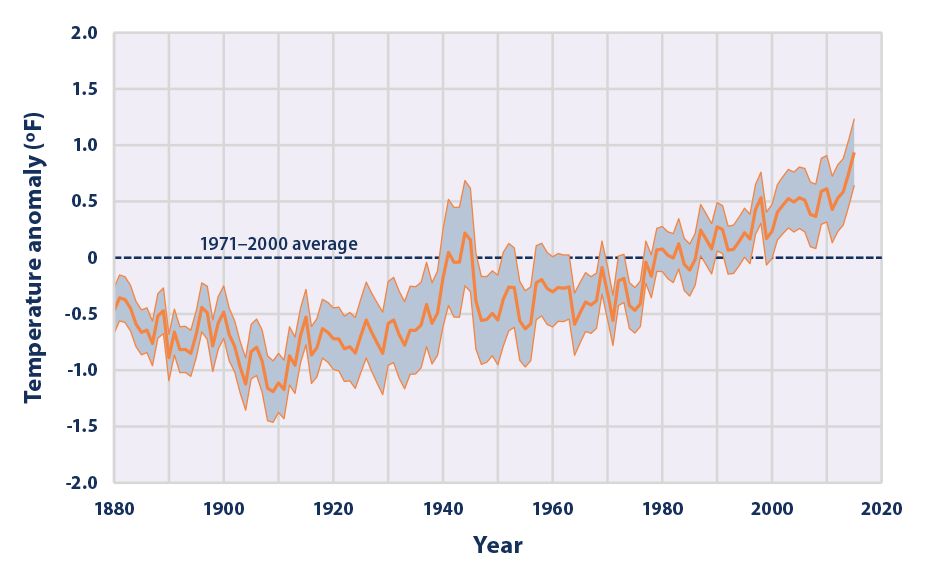
Sea surface temperature (SST) measurements provide the basis for the prediction of climate change, ocean currents and ocean cycles such as El Nino. The exact meaning of “surface” can refer from anywhere from between 1 mm and 20 m below the sea surface. The first measurements of SST were made in the 18th century by dipping mercury thermometers into the sea from ships travelling between the United States and Europe. A later approach was to collect a bucket of water from the sea and insert a thermometer into the bucket, but this led to biases in the temperature due to heating or cooling of the water by the bucket itself. Automated techniques were developed in the 1960s, which drew in water through the intake port of large ships, but the effect of the heat from the engine room means that these measurements were biased by up to 0.6°C, much larger than climate change signals. Fixed weather buoys over the ocean are another way to measure the SST at a depth of 3 m, with algorithms developed to convert these values into surface measurements. Weather satellites have been available for SST since 1967 and from the early 1980s satellites have been increasingly used to measure SST because of the superior spatial and temporal measurement capability over in-situ techniques. Figure 1 shows a merged SST data record from 1880-2015 with known bias removed.
Figure 1. The average surface temperature of the world’s oceans has changed since 1880. This graph uses the 1971 to 2000 average as a baseline for depicting change. Choosing a different baseline period would not change the shape of the data over time. The shaded are shows the uncertainty in the data. Credit: NOAA, 2016.
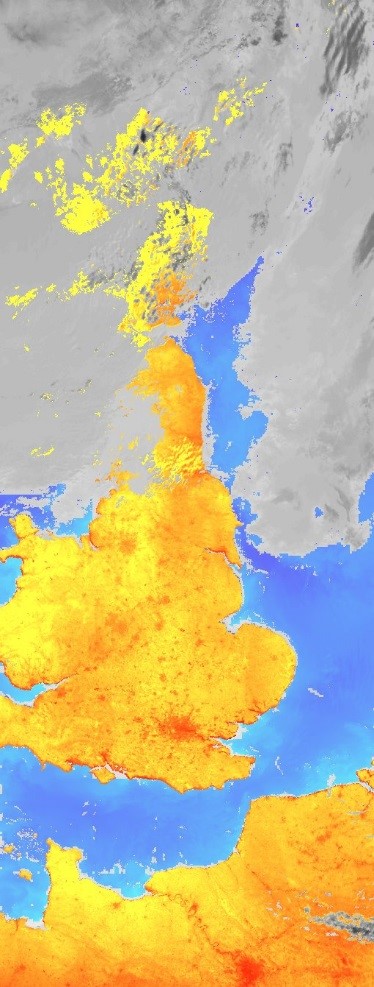
Land surface temperature (LST), Figure 2, is important to observe as the heat rising from the Earth’s surface influences, and is influenced by weather and climate patterns. LST measurements by remote sensing techniques date back to the 1970s. LST depends on albedo, vegetation cover and soil moisture. There are several important unanswered questions regarding LST: 1) are increasing greenhouse gases affecting LST? 2) are rising temperatures affecting melting rates in glaciers, ice sheets, permafrost? 3) does changing LST affect the vegetation in ecosystems? A more practical use of LST measurements is for commercial farmers who want to know how much heat stress their land is under so that they can judge when they should water their crops.
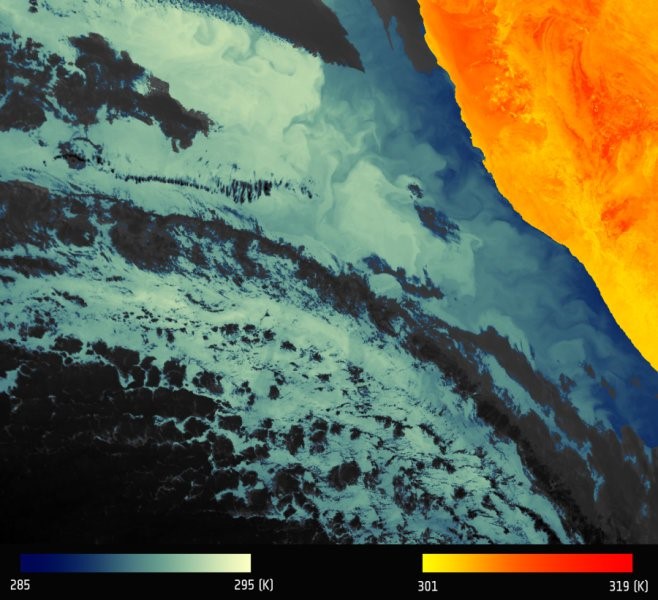
Figure 2. AATSR land surface temperature for the UK, 16/07/2005 (night-time) with warmest areas in red. Credit: ESA/University of Leicester.Figure 3. The first image from the Sentinel-3A Sea and Land Surface Temperature Radiometer (SLSTR) thermal-infrared channels depicts thermal signatures over a part of western Namibia and the South Atlantic Ocean. Credit: Contains modified Copernicus Sentinel data [2016], processed by ESA. Taken from [2]
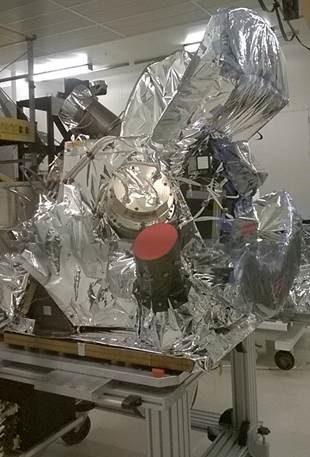
The series of along-track scanning radiometers (ATSRs) were dedicated to measuring surface temperature from space, jointly funded by the UK and Australia. The first in the series of these multi-channel radiometers was ATSR-1, the second ATSR-2, the third, the Advanced ATSR (AATSR). The first three ATSRs covered 1991 to 2012, providing almost 21 years of continuous land and sea surface temperature observations. The fourth ATSR, called the Sea and Land Surface Temperature Radiometer (SLSTR), was funded and developed directly by ESA and the first of three instruments was launched in February 2016 on ESA’s Sentinel-3A satellite. For climate monitoring purposes, the required accuracy for ATSR-derived SST is better than 0.3°C with a stability of 0.1°C/decade. In order to achieve this, ATSR viewed the surface at two angles, one close to nadir and the other along the satellite track at close to 55° from the nadir, therefore providing two views with different effective atmospheric thicknesses. The SLSTR design incorporates the basic functionality of the ATSR, but with a wider swath width, more spectral bands and a spatial resolution of 0.5 km for visible and SWIR bands, Table 1. Within a few weeks of the sensor being switched on, ESA released the first image from SLSTR thermal-infrared channels, Figure 3, showing thermal signatures over part of western Namibia and the South Atlantic Ocean. The Sentinal-3A commissioning phase ended on 12th July 2016 and responsibility of routine operations moved from ESA to EUMETSAT.
Performance Parameters
SLSTR
AATSR & ATSR-1/2
Swaths
Nadir view
1,400 km
500 km
Dual view
740 km
500 km
Global coverage revisit time
1 S/C (dual view)
1.9 days
7-14 days
0.9 days
–
1 day
7-14 days
0.5 days
–
SSI at SSP (km)
0.5 km VIS-SWIR 1 km IR-fire
1 km
Spectral channels centre λ (µm)
VIS (not ATSR-1)
0.555; 0.659; 0.865;
0.555; 0.659; 0.865;
SWIR
1.375; 1.610; 2.25;
1.610;
MWIR/TIR
3.74; 10.85; 12;
3.74; 10.85; 12;
Fire-1/2
3.74; 10.85
–
Radiometric resolution
VIS (a=0.5%)
SNR > 20
SNR > 20
SWIR (a=0.5%)
SNR > 20
SNR > 20
MWIR (T=270K)
NeΔT < 80 mK
NeΔT < 80 mK
TIR (T=270K)
NeΔT < 50 mK
NeΔT < 50 mK
Fire-1 (<500 K)
NeΔT < 1K
Fire-2 (<400 K)
NeΔT < 0.5 K
Radiometric accuracy
VIS-SWIR (a=2-100%)
< 2% (BOL)
< 5% (EOL)
< 5%
MWIR-TIR (265-310K)
< 0.1 K (goal)
< 0.1 K
Fire (<500k)
< 3 K
Life time (in orbit)
7.5 years
AATSR: 5 year design, operative since 2002;
ATSR-2: 3 year design, operating from 1995 to 2008;
ATSR-1: 3 year design, operating from 1991 to 2000
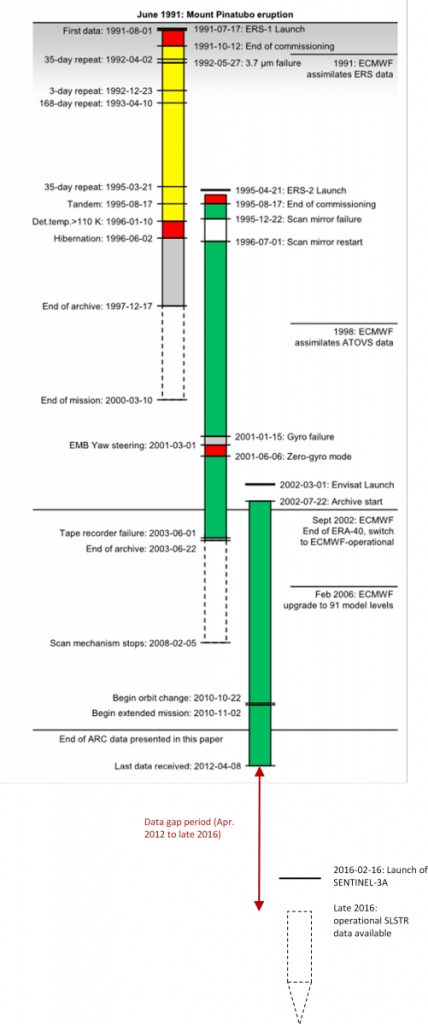
Table 1: Comparison of SLSTR specification with respect to previous AATSR and ATSR-1/2 instrument performance.Figure 4. Timeline of events affecting ATSR missions and indication of relative ARC SST quality within the ARC data set. The red arrow indicates the period between the loss of the AATSR mission and the beginning of SLSTR data availability. Adapted from [Merchant et al. 2012].
While the bulk of the work within FIDUCEO focusses on historic records, the techniques that will be developed will be applicable to SLSTR. After the unexpected demise of the Envisat mission (including AATSR) in 2012, there was suddenly a gap in the ATSR data record which will not be filled until the availability of SLSTR, Figure 4. Within FIDUCEO, improvements will be applied in the calibration of other instruments AVHRR/HIRS to develop a proxy fundamental climate data record to fill the gap. Comparisons of SLSTR radiances will also be made to another instrument, IASI, a well-calibrated, stable, spectrometer, building on efforts at the University of Leicester to inter-compare the IASI and AATSR radiances [3]. Alongside these activities, tools and knowledge gained in FIDUCEO will be used to perform a fundamental study of the in-orbit calibration of SLSTR with the emphasis on metrology. These activities will leverage international efforts on inter-calibration of sensors. During the first few months of the project, the University of Reading were part of a paper [4] which investigated the AATSR-IASI bias derived from collocated pixels over the period January 2008 through to March 2011 (i.e. covering different years and seasons). The analysis indicated:
The AATSR nadir view and the IASI can act as good reference instruments and IASI is much more accurate than its design specification [<0.1–0.2 K (650–1750 cm−1) and 0.2–0.4 K (1750–2500 cm−1)].
AATSR-IASI bias is close to the AATSR pre-launch bias implying that IASI can get close to pre-launch levels of accuracy.
There is a temperature dependent bias in the AATSR at T< 240 K, which seemed to appear after the orbit of Envisat was lowered in October 2010.
There is a very small scan angular dependence of AATSR-IASI bias.
The FIDUCEO activities related to SLSTR are expected to begin in March 2017, after the stable temperature data are released.
References:
Merchant, C. J., et al.: A 20 year independent record of sea surface temperature for climate from Along-Track Scanning Radiometers, J. Geophys. Res., 117, C12013, doi:10.1029/2012JC008400, 2012.
Illingworth et al.: Intercomparison of integrated IASI and AATSR calibrated radiances at 11 and 12 μm, Atmos. Chem. Phys., 9, 6677-6683, doi:10.5194/acp-9-6677-2009, 2009.
Bali, M., Mittaz, J., Maturi, E., and Goldberg, M.: Inter-comparison of IASI and AATSR over an extended period, Atmos. Meas. Tech. Discuss., 8, 9785-9821, doi:10.5194/amtd-8-9785-2015, 2015.