
By Alison Fowler, April 2024
The waters surrounding our coastline may seem deep and empty, but they are full of life. It is the tiniest of these organisms, the phytoplankton and zooplankton, that form the lowest levels of the food web. The plankton sustains everything from the local fisheries all the way up to the basking shark, the largest fish to visit the British seas.
Unfortunately, the warming of waters, acidification, and sewage discharge are negatively impacting the coastal marine ecosystem, resulting in harmful algae blooms and hypoxic (low-oxygen) dead zones.
Key health indicators of the marine ecosystem
To support mitigation against these harmful events, the monitoring and forecasting of key marine health indicators, like net primary production, pH, and seafloor oxygen concentration, are necessary. However, creating computational models of the complex processes that control how the ecosystem evolves is no easy feat.
Models, such as ERSEM, represent the changes in the plankton over time, including the flow of nutrients and carbonates needed to maintain them, and the organic matter produced and then decomposed by bacteria. ERSEM is coupled to physical models describing the evolution of temperature, salinity, the currents and vertical mixing. Unlike the ocean physics, the equations representing the ecological processes are poorly constrained and depend on many parameters (> 400 in the case of ERSEM). To make the models tractable, the tens of thousands of plankton species are grouped into a handful of functional types based on organism/cell size. As only the average behaviour of the groups can be modelled, this means that local details are not as well simulated as large-scale properties, and forecasts of marine ecology using models alone can have large uncertainties and biases.
The role of data assimilation
But of course, we have data assimilation, which helps us keep uncertain models in line with reality by constraining them with information from observations. The problem is that the marine ecosystem is hard to observe.
The most abundant source of information comes from satellite observations of ocean colour. Ocean colour data provides information about the total chlorophyll-a concentrations present in the surface waters. Chlorophyll is used in photosynthesis, hence, it is a proxy for the total surface phytoplankton present. The computational model then provides a medium for the observations of ocean colour to constrain some of the other modelled variables. But not all.
Quantifying where new observations are needed
The need for more observations to monitor and forecast key health indicators of the marine ecosystem is clear. But given the difficulty in achieving this what instruments are needed and where should they be placed?
This question can be addressed by simultaneously quantifying two things. Firstly, which of the key health indicators are most difficult to model? Secondly, which indicators do ocean colour observations constrain the least? A recent collaboration between PML, the Met Office and UoR has set out to do just this for the shelf seas surrounding North-west Europe.
The difficulty in modelling the key health indicators was quantified by assessing the sensitivity of the modelled indicators to the known uncertainties in the modelled equations. These uncertainties include the ecological parameters, the physical mixing scheme, and the atmospheric forcing. The current observability of the indicators was quantified by comparing the change in their uncertainty with and without the assimilation of the ocean colour data over a 7-month biologically productive period.
Where to direct our resources?
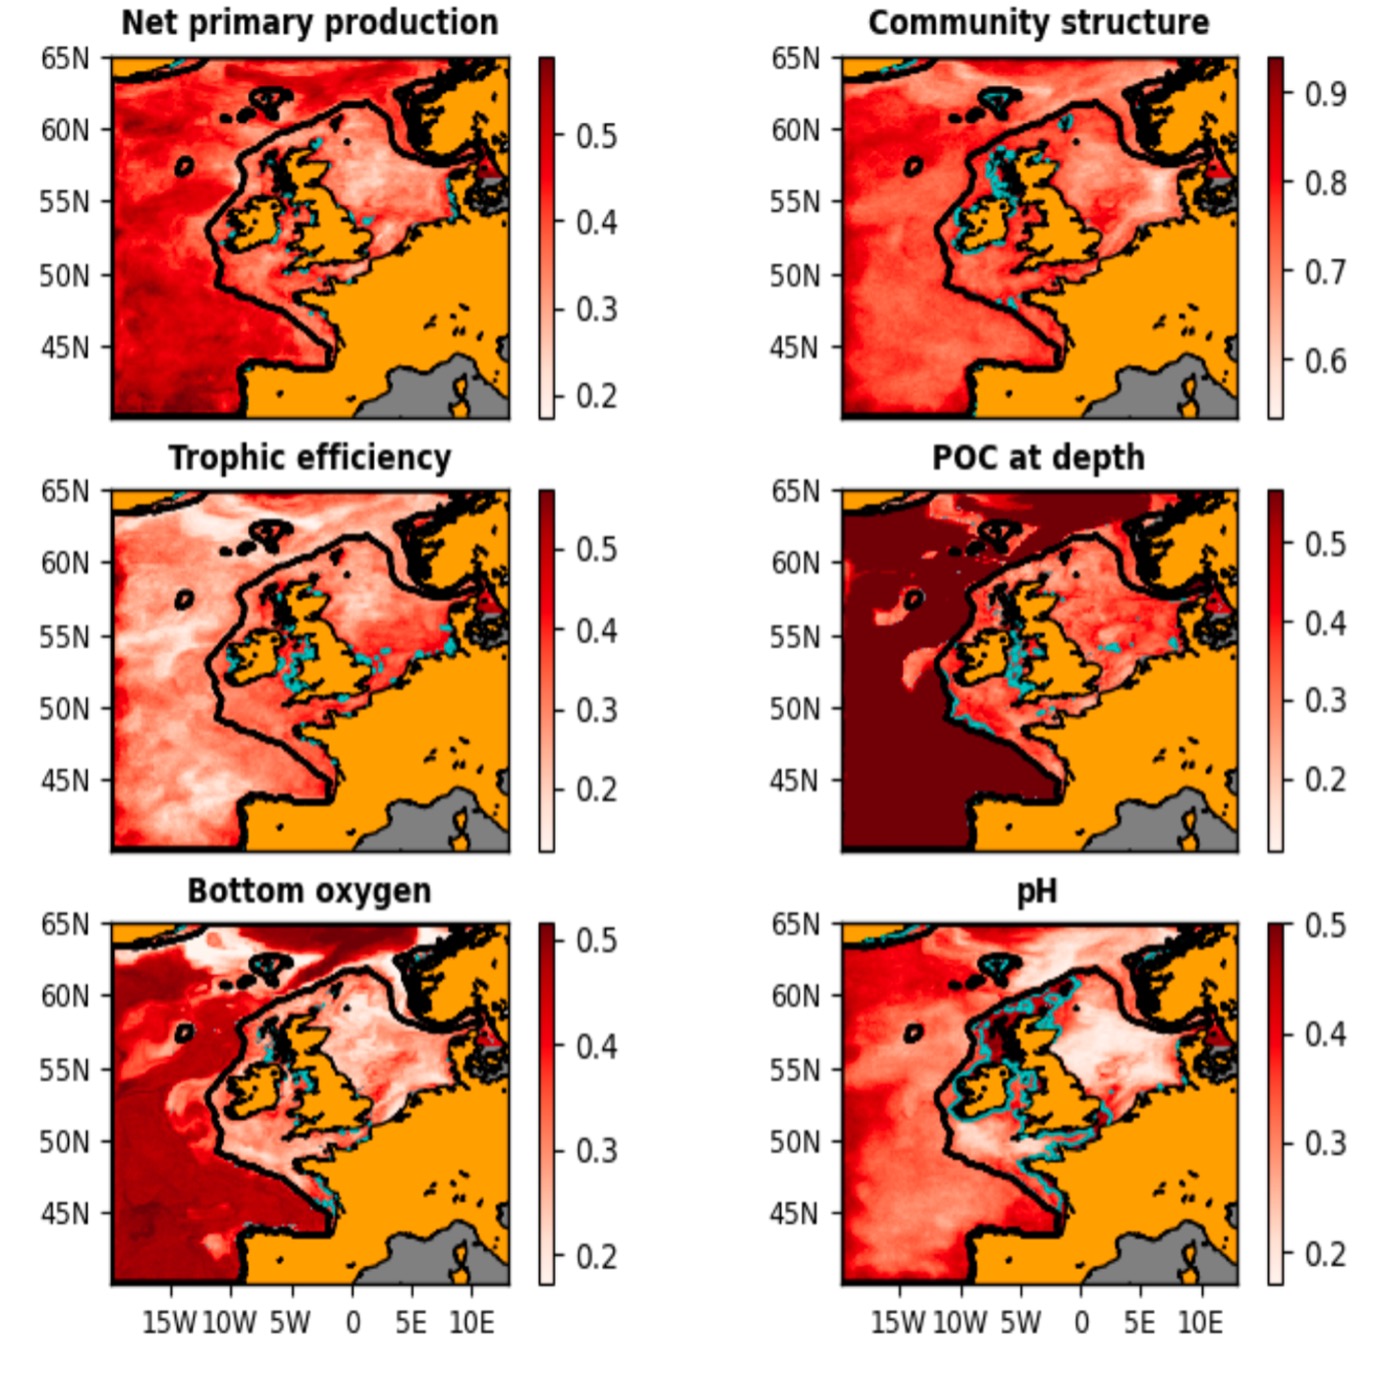
The results showed that currently, the greatest need for more observations is in the coastal regions around the UK and Ireland. This is especially true for phytoplankton community structure (see figure). Fortunately, the development of remotely sensed phytoplankton community structure products has seen huge progress in the last decade. The next step should then be to assimilate these products operationally.
This work provides a framework to further develop the marine observing network. A particularly exciting opportunity is the technological advances in autonomous gliders. We need to consider how data assimilation will potentially use new observations and the additional information introduced given the already available observations. By doing so, we can focus our resources on ensuring that the observations have the maximum impact in helping us predict and mitigate against future harmful marine ecology events.
Further reading
How uncertain and observable are marine ecosystem indicators in shelf seas? Progress in Oceanography, 2024.
Challenging autonomous gliders in the coastal seas PML newsletter